Rogue Wave Views Gantt
The Gantt Chart package is included in the Rogue Wave® Views base product. It manages the display and editing of scheduling data. Scheduling is the process of assigning resources to activities in time.
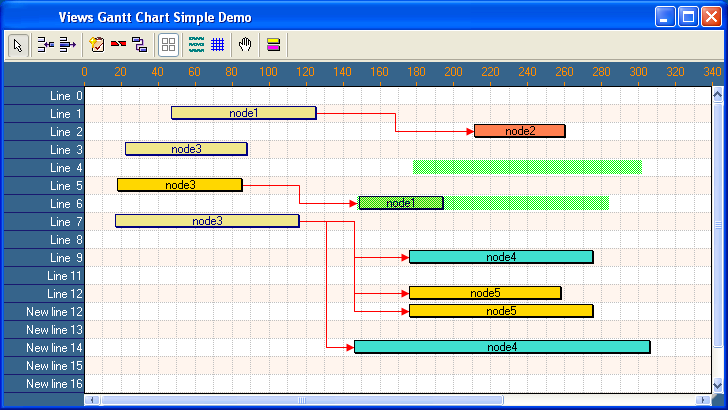
The Gantt, or time line, chart typically is a horizontal bar chart that shows the time relationships between tasks in a project.
Figure 0.15 Example of a Gantt Chart
With Rogue Wave Views Gantt charts, you can create, edit, and manage for very large sets of data:

Resources and tasks, the general inputs of a scheduling problem.
Activities and subactivities, which have start time, end time, and resource capacities.
Precedence constraints, showing task dependencies. These are defined by Gantt links which have a starting activity, ending activity, and a delay.
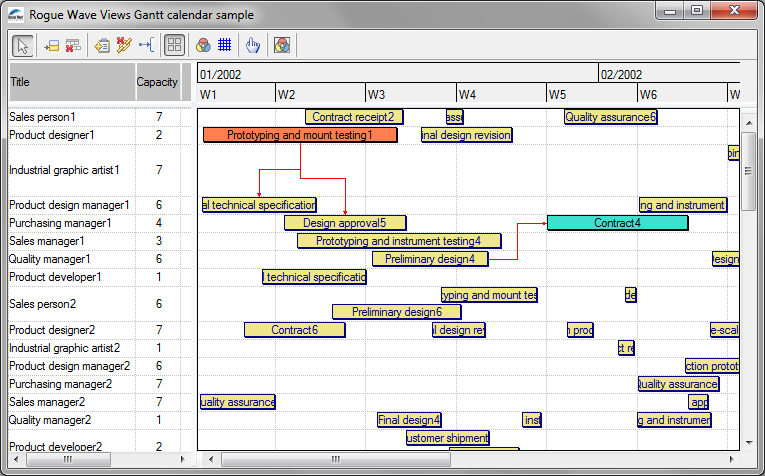
Here is an example of a calendar application:
Figure 0.16 A Gantt Chart Calendar Application
For complete details see the Rogue Wave Views Gantt User’s Manual.
Included in: Rogue Wave Views.
Version 5.8
Copyright © 2014, Rogue Wave Software, Inc. All Rights Reserved.