Projection Page
The Projection page lets you define the type of projection to map the data into screen coordinates.
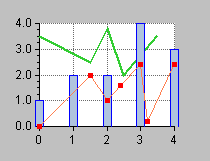
 Cartesian
 is used for data expressed in Cartesian coordinates (
x,
y). The data are represented in a standard manner: the abscissa and ordinate scales representing the x- and y-coordinates, respectively, are orthogonal.
Figure 1.7 Example of a Cartesian Chart
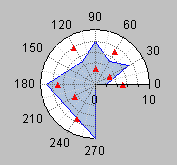
Polar is used for data expressed in polar coordinates (
θ,
ρ). The data are represented in a circular way: the
θ values are mapped along a circular abscissa scale, while the
ρ values are represented along a radial ordinate scale.
Figure 1.8 Example of a Polar Chart
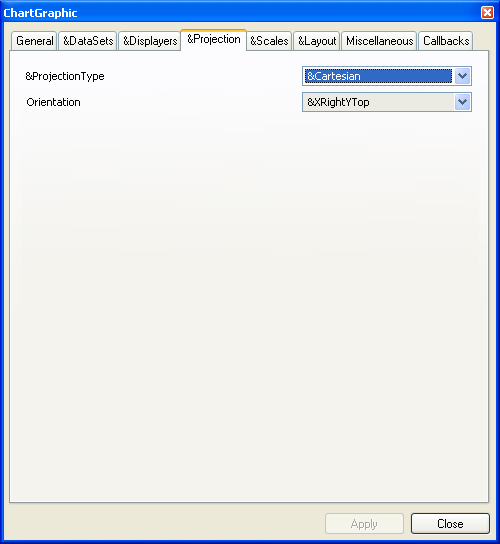
The Projection page appears as follows:
Figure 1.9 Chart Inspector: Projection Page
Once you have selected the type of the projection to be applied, you can define:
The orientation of the scales for a Cartesian projection.
The orientation of the abscissa scale (clockwise or counterclockwise) for a polar projection.
Version 5.5.1
Copyright © 2012, Rogue Wave Software, Inc. All Rights Reserved.