Creating Table Representations
As explained in
“Overview”., a view is a representation of all or part of a server object model that is mapped to data source tables. Using these data source tables, you will then connect the selected server classes to their graphical representation.
You are now going to create a table representation to map a network and its domains to Rogue Wave Data Access data sources. A table representation is a set of two Views data sources: a Main data source and a Properties data source.
The DomainsOfNetwork view is associated with the Network panel that shows a network with its domains. The view definition, therefore, should contain the classes Network and Domain. This section explains how to represent these classes using data source tables.
Creation of the view DomainsOfNetwork is possible because the class Network has a one-to-many relation (called domains) that contains all the Domains in a given Network. Hence, creating this view means displaying the relation domains in the class Network.
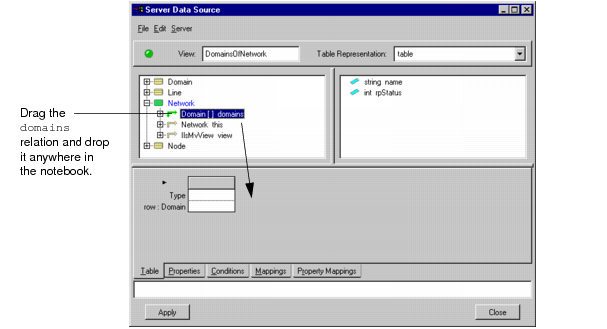
To do so, simply drag this relation from the top pane —where it is represented in the model— to the bottom pane —where we will create a table representation associated with the relation— as shown below.
To create a table representation of the Network and Domain classes:
1. Click on the plus (+) sign before the Network class in the top pane of the inspector panel to expand it.
The domains relation appears. This relation links the class Network to the class Domain: a network owns one or more domains.
2. Drag the domains relation and drop it anywhere onto the Table notebook page in the bottom pane.
A ghost Domain[] domains placeholder or a dashed outline moves with the pointer

.
Figure 8.10 Dragging a Relation onto the Table Notebook Page
This operation causes several events to take place:

A
row is added to the Table section of the bottom pane. This row represents a domain and is used to fill the Main data source at runtime with the domains owned by the network.

Two data source tables are created in the notebook pages of the inspector panel:

The
DomainsOfNetwork::table data source is created on the Table notebook page. This is the Main data source.

The
DomainsOfNetwork::table(properties) data source is created on the Properties notebook page. This is a data source of properties that apply to the whole table.
Both data source tables are associated with the server class Network.

The
Network class is automatically set as the
origin of the view.

The
Network class name has turned blue, while the
Network class icon and the double-headed arrow before the
domains relation have changed to green, indicating that
notification will be propagated to objects of the class
Domain through the
domains relation, starting from the
Network origin. In other words, when a view
DomainsOfNetwork is opened with
Network as its origin, its graphic representation is created. This event is then propagated, or notified, to all the domains that are linked to the network via the
domains relation, and their graphic representation is created. In this case, this results in rows being added to the Main data source.

A table item appears in the Table Representation combo box above the right upper pane.

If appropriate, a
collector attribute is automatically added to the Collectors table in the Edit Table Representation Properties dialog box.
Note: If, for any reason, you do not want a collector in your table, you can delete the row in the Edit Table Representation Properties dialog box. |
In this section, with a very simple drag-and-drop operation, you have created two data source tables. The sections below explain how to fill these tables.
Version 5.7
Copyright © 2013, Rogue Wave Software, Inc. All Rights Reserved.
 .
. .
.