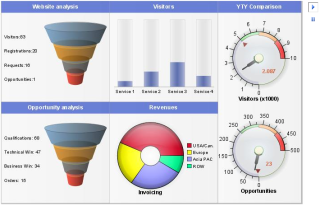
Perforce JViews Diagrammer Sample: Dashboard
Description
 |
A JSF dasbhoard displaying an .idbd project file.
How to Use the Sample
.idbd project file.
- Press the play button
 to start monitoring.
 - Press the pause button
 to stop monitoring.
Installing the Thin-Client Sample
The sample contains a WAR file (Web Archive) that allows you to easily install the sample on any server that supports the Servlet API 2.1 or later. For your convenience, the WAR will be copied to the Tomcat web server that is supplied with the Perforce JViews installation when you start the server using the supplied scripts. Tomcat is the official reference implementation of the Servlet and JSP specifications. If you are already using an up-to-date Web or application server, there is a good chance that it already has everything you need. The sample can also be deployed to WebSphere Application Server (WAS).
Running the Sample Using Tomcat
If you intend to use the Tomcat Web server provided with this
installation, follow these instructions to start the server:
Running the Server-Side Samples.
The scripts to start the server can be found in the
tools/tomcat-jsf directory.
Note: if you are running on Windows then you will find menu items in
the Windows "start" menu to start and stop the Tomcat server.
Once the server is running, you can see the sample by opening the following page:
- Perforce JViews Diagrammer Sample: Dashboard
http://localhost:8080/jsf-diagrammer-dashboard
Running the Sample Using WebSphere Application Server
In addition to the instructions provided for using Tomcat, the samples can be
viewed on WebSphere Application Server. Follow the instructions:
Running the Server-Side Samples
and use the scripts to start the server and deploy the sample.
Once the server is running, you can see the sample
by opening the following page:
http://localhost:9443/jsf-diagrammer-dashboard
The WAS administrative console can be used to verify or modify server settings:
http://localhost:9043/ibm/console/
Note: the WAS server can start on a range of port numbers, therefore the value
is not guaranteed to remain the same.
The scripts provided with the samples can be used to obtain the port numbers used
by the Admin Console and by the deployed Web applications.
To retrieve a list of all the WAS port numbers, run the command line instruction:
ant -f build_was.xml ws.list.ports
Topics Covered
- JavaServer Faces Dashboard
- Thin client
- Load Perforce JViews Dashboard project files
Detailed Description
This sample displays a dashboard loaded from an .idbd project file with a
JavaServer Faces component.
Installation Directory
The Dashboard sample is installed here.