Perforce JViews Charts Sample: Polar Charts
Description
 |
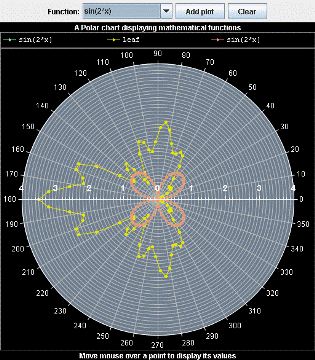
This sample shows how a Polar chart can be used to display mathematical functions.
Polar charts are like parametric charts, when one of the two parameters has a circular or "periodically repeatable" semantics.
How to Use the Sample
- The combo box allows you to change the function to display.
- The Add plot button stores the last function, so that selecting another function adds a new renderer to the chart.
- The Clear button removes all the renderers, except the one representing the selected function.
How to Run the Sample as an Application
This sample can
be run as an application.
The installation directory contains
an executable JAR file,
polar.jar,
that allows you to execute the sample with a double click from a
file browser. Note that if you are using Internet Explorer, you can
open the installation directory
and execute the JAR file from the browser. This
technique may not work in other Web browsers.
Alternatively, you
can run the sample application from the command line.
First check that the Ant utility is properly configured. If not, see the
instructions on how to configure Ant for Perforce JViews.
Then, go to the installation directory
of the sample and type:
ant run
Topics Covered
- Using the
IlvFunctionDataSetclass to represent mathematical functions. - Using Polar charts.
Detailed Description
This sample displays mathematical functions with polyline renderers. The function to display can be chosen from a combo box. You can also stack the representation of several functions.
Installation Directory
The Polar Charts sample is installed here.
Classes Involved
- ilog.views.chart.IlvChart
- ilog.views.chart.graphic.IlvGradientRenderingHint
- ilog.views.chart.renderer.IlvPolylineChartRenderer
- ilog.views.chart.data.IlvFunctionDataSet