Perforce JViews Charts Sample: Parametric Charts
Description
 |
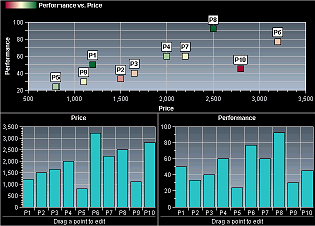
This sample shows a parametric chart that displays a set of values against a set of other values.
How to Use the Sample
How to Run the Sample as an Application
This sample can
be run as an application.
The installation directory contains
an executable JAR file,
parametric.jar,
that allows you to execute the sample with a double click from a
file browser. Note that if you are using Internet Explorer, you can
open the installation directory
and execute the JAR file from the browser. This
technique may not work in other Web browsers.
Alternatively, you
can run the sample application from the command line.
First check that the Ant utility is properly configured. If not, see the
instructions on how to configure Ant for Perforce JViews.
Then, go to the installation directory
of the sample and type:
ant run
Topics Covered
- Using combined data sets to display parametric charts.
-
Subclassing
IlvGradientRenderingHintand changing the values that are mapped into colors. In this sample, the color of a data point depends on the ratio between its y-value and its x-value. -
Overridding the
drawLegendSymbol()method of a chart renderer to display a legend symbol filled with a gradient.
Detailed Description
Parametric charts are perfect to see the correlation between two parameters. The parameters are assigned to the x axis and the y axis, respectively.
In this sample, we use a subclass ofIlvCombinedDataSet
to display a set of values against another set of values. Two charts are
used to display the price and the performance of a set of products. A
parametric data set is created from the price and performance data
sets. This parametric data set is displayed by a scatter chart, where the
color of each marker depends on the ratio between the performance and the
price of the corresponding product (a green color indicates that the product
has a good performance-price ratio, while a red color indicates that this
ratio is poor).
The change of color is handled by a subclass of
IlvGradientRenderingHint.
The transition values of the gradient are computed according to the best
and worse ratio among the set of products. A listener is set on the
parametric data set so that the transition values are updated if the best
or the worse value changes.
An editing interactor is set on the price and performance charts, which
lets you change each product characteristic and witness the visual effect
on the parametric chart.
Installation Directory
The Parametric Charts sample is installed here.
Classes Involved
- ilog.views.chart.data.IlvCombinedDataSet
- ilog.views.chart.graphic.IlvGradientRenderingHint
- ilog.views.chart.renderer.IlvSingleScatterRenderer
- ilog.views.chart.renderer.IlvSingleBarRenderer
- ilog.views.chart.interactor.IlvChartDataInteractor
- ilog.views.chart.event.DataSetListener