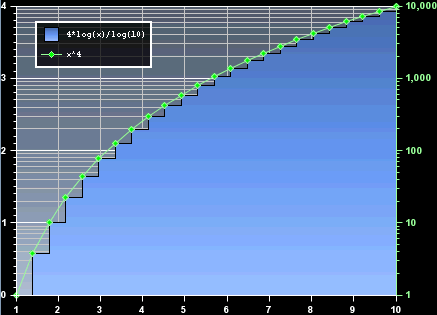
Perforce JViews Charts Sample: Logarithmic Scales
Description
 |
This sample shows how to use a logarithmic scale in a chart.
How to Use the Sample
- You can change the docking location of the legend by clicking on its border and dragging it.
How to Run the Sample as an Application
This sample can
be run as an application.
The installation directory contains
an executable JAR file,
logarithmic.jar,
that allows you to execute the sample with a double click from a
file browser. Note that if you are using Internet Explorer, you can
open the installation directory
and execute the JAR file from the browser. This
technique may not work in other Web browsers.
Alternatively, you
can run the sample application from the command line.
First check that the Ant utility is properly configured. If not, see the
instructions on how to configure Ant for Perforce JViews.
Then, go to the installation directory
of the sample and type:
ant run
Topics Covered
- Logarithmic scale
- Multiple Y axis
Detailed Description
This sample shows how to use a logarithmic scale in a chart. A new Y-axis
is added to the chart as the second coordinate system and initialized with
a logarithmic transformer (instance of
IlvLogarithmicAxisTransformer). Then, the logarithmic scale
is created and associated to this new Y-axis. Finally, to define how scale
step values are computed, an IlvLogarithmicStepsDefinition
instance is set on the scale.
Once initialized, the scale is positioned at the right side of the data
display area.
Two functions (through their corresponding
IlvFunctionDataSet data sets) are used as input data and are
rendered with two renderers:
- A green polyline with markers, connected to the logarithmic scale. The associated function is y = x^4.
- A blue stair chart, connected to the first coordinate system. The associated function is y = 4*log(x)/log(10).
Installation Directory
The Logarithmic Scales sample is installed here.
Classes Involved
- ilog.views.chart.IlvChart
- ilog.views.chart.IlvScale
- ilog.views.chart.IlvLogarithmicAxisTransformer
- ilog.views.chart.IlvLogarithmicStepsDefinition
- ilog.views.chart.data.IlvFunctionDataSet