Perforce JViews Charts Sample: Data Set Listeners
Description
 |
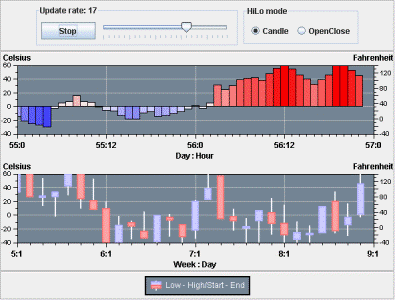
This sample shows how to synchronize several datasets. It simulates the visualization of successive temperature samples. A first chart (on the top) is used to display the actual temperature measurements carried out every hour of the day. A second one is used to display the temperature variations during the day.
How to Use the Sample
- Press Animate to launch the simulation.
- Move the slider to adjust the timer period.
- Changes the type of the
HiLoChartRendererusing the radio buttons.
How to Run the Sample as an Application
This sample can
be run as an application.
The installation directory contains
an executable JAR file,
listener.jar,
that allows you to execute the sample with a double click from a
file browser. Note that if you are using Internet Explorer, you can
open the installation directory
and execute the JAR file from the browser. This
technique may not work in other Web browsers.
Alternatively, you
can run the sample application from the command line.
First check that the Ant utility is properly configured. If not, see the
instructions on how to configure Ant for Perforce JViews.
Then, go to the installation directory
of the sample and type:
ant run
Topics Covered
- Synchronization of several data sets using listeners.
- Customization of scale labels.
- Using a gradient rendering hint.
- Using a second ordinate scale to display a different unit.
Detailed Description
This sample shows how to synchronize several data sets using listeners. This sample simulates the visualization of successive temperature samples. To do this, it uses two chart objects:
- The first one is used to display the actual temperature measurements. The temperature is rendered with bars whose color depends on the value of the temperature (blue for negative values, red for positive values). The temperature measurements are handled by a data set updated randomly at a given period. The sample assumes that a measurement is carried out every hour of the day.
- The second one is used to display the temperature variations for a given period of time (in the case of the sample, a day). To do this, it is connected to 4 data sets representing:
- The lowest temperature during the day.
- The highest temperature during the day.
- The temperature at the beginning of the day.
- The temperature at the end of the day (during the day, the value is set to the last measurement).
These 4 data sets are updated through a listener set
on the temperature data set. This listener is notified whenever a new
measurement is available and updates the high/low start/end values
accordingly. To render these data sets, an instance of
IlvHiLoChartRenderer is used. The color of the start-end
bar depends on whether the temperature at the end of the day is greater
or lower than the temperature at the beginning of the day.
Every drawing update (scrolling/invalidation of the variations display) is carried out automatically by the chart.
This sample also shows how a second y-scale can be used to display a different unit.
Installation Directory
The Data Set Listeners sample is installed here.
Classes Involved
- ilog.views.chart.IlvChart
- ilog.views.chart.event.DataSetListener
- ilog.views.chart.data.IlvDefaultDataSet
- ilog.views.chart.renderer.IlvBarChartRenderer
- ilog.views.chart.renderer.IlvHiLoChartRenderer
- ilog.views.chart.IlvScale
- ilog.views.chart.IlvAffineAxisTransformer
- ilog.views.chart.graphic.IlvGradientRenderingHint