Perforce JViews Charts Sample: Treemap (JSF and JavaScript)
Description
 |
This sample shows how to use treemap charts for navigation in a thin-client environment, with the JSF chart component. A servlet loads a tree-structured model and generates an image of a treemap chart and its corresponding client-side image map.
How to Use the Sample
index.html file in your browser to see an
image of the treemap chart. The treemap image and the image map are
generated on the fly by the JSP servlet. Then, click a rectangle of
the treemap to open the URL associated with the corresponding rectangle.
Installing the Thin-Client Sample
The sample contains a WAR file (Web Archive) that allows you to easily install the sample on any server that supports the Servlet API 2.1 or later. For your convenience, the WAR will be copied to the Tomcat web server that is supplied with the Perforce JViews installation when you start the server using the supplied scripts. Tomcat is the official reference implementation of the Servlet and JSP specifications. If you are already using an up-to-date Web or application server, there is a good chance that it already has everything you need. The sample can also be deployed to WebSphere Application Server (WAS).
Running the Sample Using Tomcat
If you intend to use the Tomcat Web server provided with this
installation, follow these instructions to start the server:
Running the Server-Side Samples.
The scripts to start the server can be found in the
tools/tomcat-facelets directory.
Note: if you are running on Windows then you will find menu items in
the Windows "start" menu to start and stop the Tomcat server.
Once the server is running, you can see the sample by opening the following page:
- Perforce JViews Charts Sample: Treemap (JSF and JavaScript)
http://localhost:9090/jsf-chart-treemap
Running the Sample Using WebSphere Application Server
In addition to the instructions provided for using Tomcat, the samples can be
viewed on WebSphere Application Server. Follow the instructions:
Running the Server-Side Samples
and use the scripts to start the server and deploy the sample.
Once the server is running, you can see the sample
by opening the following page:
http://localhost:9443/jsf-chart-treemap
The WAS administrative console can be used to verify or modify server settings:
http://localhost:9043/ibm/console/
Note: the WAS server can start on a range of port numbers, therefore the value
is not guaranteed to remain the same.
The scripts provided with the samples can be used to obtain the port numbers used
by the Admin Console and by the deployed Web applications.
To retrieve a list of all the WAS port numbers, run the command line instruction:
ant -f build_was.xml ws.list.ports
Topics Covered
- Treemap chart.
- Java Server Faces.
- Server-side charts generation.
- Client-side image map generation.
- Client-side interaction and navigation.
Detailed Description
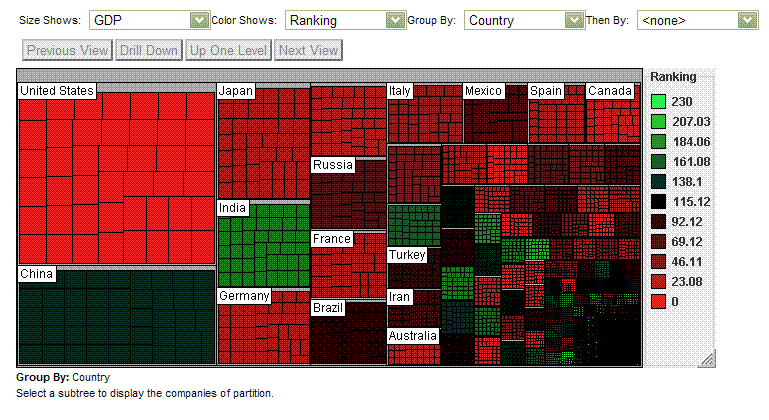
This sample shows the world-wide energy production and consumption, from 2004 to 2007, by energy type, by country, and by year. It consists of three parts:
- A tree-table, at the top left, displays the type-country-year records, grouped by type, by country, or by year. This tree-table is optimal for viewing the total consumption of energy in a more organized way.
- A treemap, at the top right, displays the type-country-year records, also grouped by type, by country, or by year, in a way that some consumption records appear big and others visually insignificant - depending on the amount of energy - or some records stand out - depending on the type of energy. This treemap is optimal for getting an overview of all records and for spotting particular records with extraordinary size combined with specific attributes.
- A table, at the bottom, displays the raw data. This table is optimal for viewing all the details of just one record.
The selection between the three displays is synchronized. This allows you to immediately see the details of a record (in the table) when you click on it in the treemap or in the tree-table.
A set of controls is available in the centre of the panel. They have an effect on the tree-table and the treemap below them.
Installation Directory
The Treemap (JSF and JavaScript) sample is installed here.
Classes Involved
- ilog.views.chart.data.IlvTreeTableDataSource
- ilog.views.chart.renderer.IlvTreemapChartRenderer
- ilog.views.chart.datax.IlvDataColumnInfo
Source Files
- treemap.TreemapBean
- treemap.TreemapPathFinder
- treemap.TreemapWithHistory
- treemap.table.ColumnFilter
- treemap.table.FilteredFlatTableModel
- treemap.table.FlatTableModel
- treemap.table.IntervalColumnFilter
- treemap.table.StringColumnFilter