Perforce JViews Charts Sample: JDBC Data Source
Description
 |
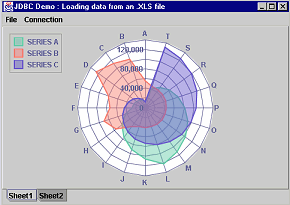
This sample displays data imported from two CSV (Comma Separated Value) files. Each file contains one set of data, and each one rendered in its own chart.
How to Use the Sample
- Once the data sets have been loaded, moving the cursor over the chart points displays their value in a tooltip.
-
Here are pictures of the sample once the two sheets contained in the
file have been loaded (the first one in a radar chart, the second one
in a Cartesian chart):


How to Run the Sample as an Application
This sample can
be run as an application.
The installation directory contains
an executable JAR file,
demo-jdbc.jar,
that allows you to execute the sample with a double click from a
file browser. Note that if you are using Internet Explorer, you can
open the installation directory
and execute the JAR file from the browser. This
technique may not work in other Web browsers.
Alternatively, you
can run the sample application from the command line.
First check that the Ant utility is properly configured. If not, see the
instructions on how to configure Ant for Perforce JViews.
Then, go to the installation directory
of the sample and type:
ant run
Topics Covered
- Loading data sets from a database using a JDBC connection. In this particular sample, the database will be CSV data files.
Detailed Description
This sample shows how to load data from a database using a JDBC connection. The data is stored in two CSV files (named respectively "csvdemo1" and "csvdemo2"). The corresponding data sets are displayed in two charts:
- A radar chart containing the data from the first sheet. This sheet contains three columns, each column being associated with one data set, and each data set being displayed by an area renderer with a predefined rendering style.
- A Cartesian chart containing the data from the second sheet. This sheet contains three columns: stock, input, and output, each one being stored in a data set. The first data set (the "stock" column) is rendered using a bar renderer. The second and third columns are rendered using one bar renderer containing their corresponding data sets, so that they are displayed side by side for each category.
IlvJDBCDataSource initialized for a JDBC-CSV
connection (the connection string is equal to
jdbc:relique:csv:data
and the driver name toorg.relique.jdbc.csv.CsvDriver).
For the two files stored in the data directory, a query is executed to retrieve
the data and build the corresponding data sets.
Installation Directory
The JDBC Data Source sample is installed here.
Classes Involved
- ilog.views.chart.IlvChart
- ilog.views.chart.data.IlvJDBCDataSource
- ilog.views.chart.renderer.IlvBarChartRenderer