Perforce JViews Charts Sample: Charts Gallery
Description
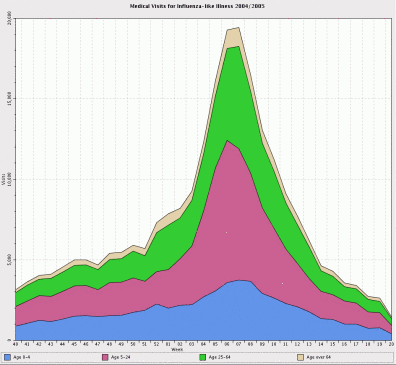 |
This sample shows a gallery of various JViews Charts projects.
How to Use the Sample
How to Run the Sample as an Application
This sample can
be run as an application.
The installation directory contains
an executable JAR file,
chart-gallery.jar,
that allows you to execute the sample with a double click from a
file browser. Note that if you are using Internet Explorer, you can
open the installation directory
and execute the JAR file from the browser. This
technique may not work in other Web browsers.
Alternatively, you
can run the sample application from the command line.
First check that the Ant utility is properly configured. If not, see the
instructions on how to configure Ant for Perforce JViews.
Then, go to the installation directory
of the sample and type:
ant run
Topics Covered
- Loading a project file.
Detailed Description
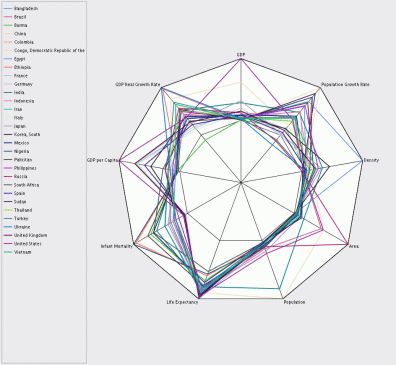
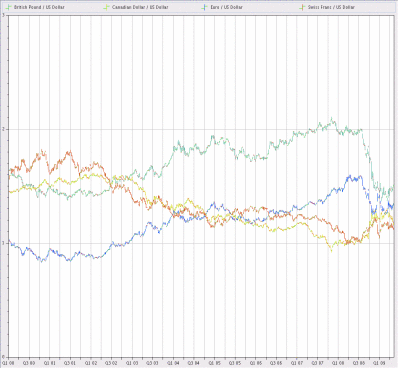
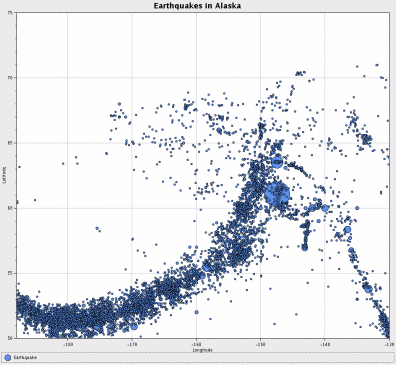
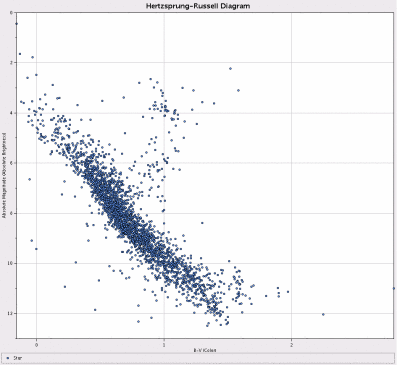
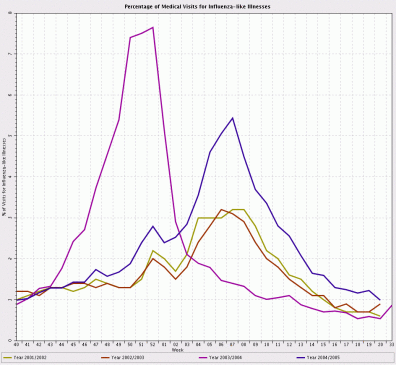
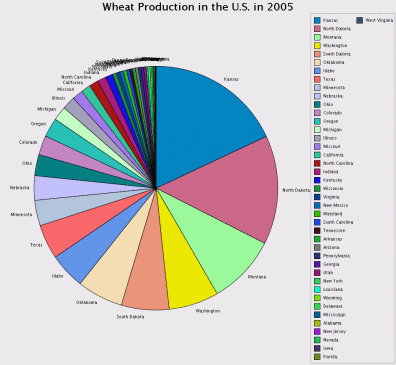
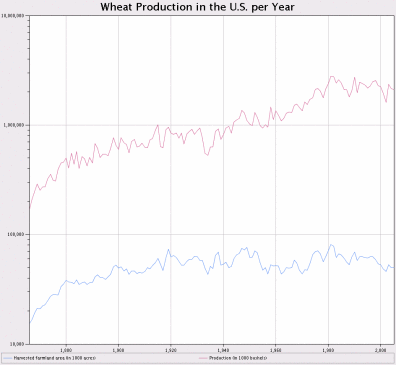
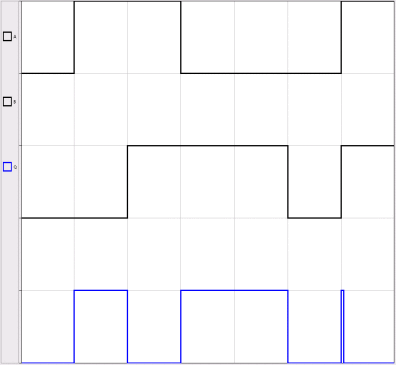
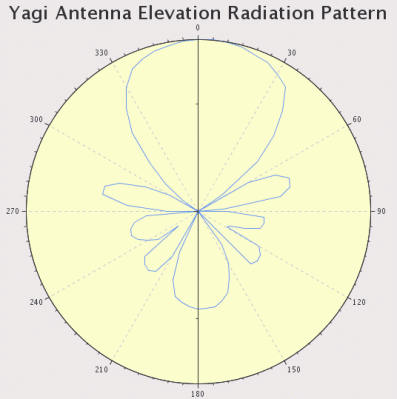
This sample shows a few chart JViews Charts projects. A project encapsulates
data and styling information for a single chart. The projects were created
with the Perforce JViews Charts Designer. They are displayed in an
IlvChart object through the IlvChart.setProject
method.
Each project is based on real data. The data was converted into an XML file (in the Perforce JViews Charts XML format) or into a tabular text file (tab-separated values text file). Then, the Perforce JViews Charts Designer was used to create a chart to display this data; the chart was saved both as a JViews Charts project file and a CSS file.
The projects display data from domains of finance, economy, geography, medicine, electronics, geology, astronomy, and others.

Installation Directory
The Charts Gallery sample is installed here.