Perforce JViews Charts Sample: Using the CSS SDK
Description
 |
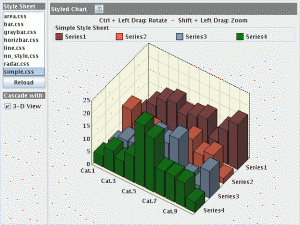
This sample demonstrates the styling capabilities of the chart component.
How to Use the Sample
- The Reload button reloads the current style sheet.
-
You can use the
 toggle button to
display a superimposed view of the style sheet contents.
- The 3-D View toggle allows you to switch to 3-D rendering. See the description of the sample for more information.
How to Run the Sample as an Application
This sample can
be run as an application.
The installation directory contains
an executable JAR file,
chart-css.jar,
that allows you to execute the sample with a double click from a
file browser. Note that if you are using Internet Explorer, you can
open the installation directory
and execute the JAR file from the browser. This
technique may not work in other Web browsers.
Alternatively, you
can run the sample application from the command line.
First check that the Ant utility is properly configured. If not, see the
instructions on how to configure Ant for Perforce JViews.
Then, go to the installation directory
of the sample and type:
ant run
Topics Covered
- Loading data from an .xml file.
- Using cascading style sheets to customize the appearance of a chart.
- Using pseudo-classes to describe the state of a data set.
Detailed Description
In this sample, we load data stored in an .xml file and connect it to a
chart. The appearance of the chart is customized with various style sheets.
We extend the IlvChart class by adding a
highlightng property. When this property is set, the chart
uses a highlight interactor.
This interactor detects when the mouse passes over the graphical
representation of the data, and adds or removes a custom pseudo-class
named highlighted on the corresponding data set.
The following style sheets are cascaded and applied to the chart component.
The Data Style Sheet
This style sheet (dataStyle.css) is referenced by an
xml-stylesheet processing instruction within the .xml file.
The style sheets that are defined within the .xml file are then accessible
through the IlvXMLDataSource.getStyleSheets() method.
The style sheet contains the following rule:
      series {
          color1: @color;
      }
This rule specifies that the primary color used to render a series
is equal to the color property of the series
elements in the .xml file.
When the sample is launched, this style sheet is the only one applied
to the chart.
A Style Sheet Specified by the User
This style sheet is chosen from the list located at the upper left
corner of the panel. Some style sheets override the rules specified in
dataStyle.css, and define other rules to control both the
appearance of the chart component and the way series are displayed.
The following sample style sheets are available:
-
area.css: Uses a stacked area representation and adds label annotations on the series with thelabeledCSS class. This is done by the following rule:series.labeled { annotation : @=annotation; }The CSS classes are defined in the .xml file with the predefinedCSSclassproperty.
Thehighlightingproperty is set on the chart using the following declaration:chart { highlighting : true; }The following rule is used to customize the highlighted data sets:series:highlighted { markerStyle : @#highlightStyle; markerSize : 6; } #highlightStyle { class : 'ilog.views.chart.IlvStyle(strokePaint,fillPaint)'; strokePaint : black; fillPaint : magenta; } -
bar.css: Uses a stacked-bar representation with gradient effects. This style sheet sets thehighlightingproperty.
-
graybar.css: Uses a stacked-bar representation with gray textures. The series are displayed using the100%stacking mode. This style sheet sets thehighlightingproperty.
-
horizbar.css: Displays horizontal bars laid out in clusters. This style sheet associates icon annotations with data points, according to their y-value:
If the y-value is greater than 15
If the y-value is less than 5
This is done by the following rules:point[y>15] { annotation: @=annoOK; } point[y<5] { annotation: @=annoKO; } -
line.css: Uses a line representation. Several stroke styles are used according to thecompanyproperty of the series. For example the rule:series[company="A"] { lineWidth : 2.0; endCap : CAP_ROUND; lineJoin : JOIN_ROUND; lineStyle : DOT; }Changes the stroke style of the lines that displays the series whose company isA. This style sheet sets thehighlightingproperty.
-
no_style.css: An empty style sheet.
-
radar.css: Uses a radar chart to display the series. This style sheet sets thehighlightingproperty.
-
simple.css: A simple style sheet that displays superimposed bars.
The 3-D Style Sheet
This style sheet (3dstyle.css) specifies properties
related to 3-D rendering. It contains the following rule:
      chart {
          3D: true;
          interactors: "3DView";
      }
The first declaration specifies that 3-D rendering should be turned on.
The second declaration sets an IlvChart3DViewInteractor
on the chart so that the view angles can be modified interactively.
This style sheet is cascaded when the 3-D View toggle is checked.
Installation Directory
The Using the CSS SDK sample is installed here.
Classes Involved
- ilog.views.chart.IlvChart
- ilog.views.chart.IlvChart3DView
- ilog.views.chart.interactor.IlvChartHighlightInteractor