Perforce JViews Charts code example gallery
How to run the code examples is explained in the starting the samples page.
Code Examples
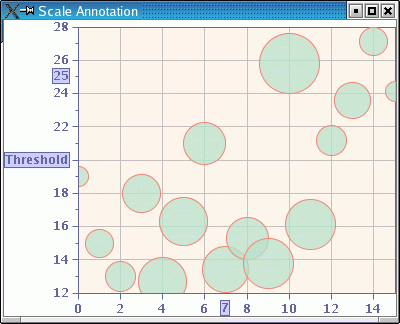
Adding Annotations in Scales

This sample shows how to add particular annotations at special values in the scales.
Axis Synchronization

This sample shows how to create several charts with synchronized axes.
Basic Chart

This sample shows how to create a basic chart.
Basic Polar Chart

This sample shows how to create a basic polar chart.
Basic Treemap Chart

This sample shows how to create a basic treemap chart.
Computing a Data Set From Other Data Sets

This sample shows how to deduce a data set from several other data sets, through operations on the y values.
Connection to Swing TableModel

This sample shows how to display values from a Swing TableModel in a chart.
Creating a Data Indicator

This sample shows how to create a fancy data indicator.
Customized Cartesian Chart

This sample shows how to do further customizations on a basic chart.
Customized Polar Chart

This sample shows how to do further customizations on a basic polar chart.
Customizing Scales Labelling

This sample shows how to customize the format of the labels attached to scales.
DataModel Extension

This sample shows how to create a custom data model class.
Designer Project File Extension

This sample shows how to use a Perforce JViews Charts Designer project file in an application and how to extend it through some interactors.
Extending the Perforce JViews Charts XML Format
This sample shows how to add extra information to a Perforce JViews Charts XML file.
Highlighting Particular Data Points

This sample shows how to display particular data points in a special way.
JavaServer Faces Charts Components

These examples show how to use the Perforce JavaServer Faces components in order to display and interact on a chart.
JViews Chart JSF in a Facelets and Trinidad context

These examples show how to use the Perforce JavaServer Faces components in a Facelets or Trinidad context.
Printing Charts Together With Text

This sample shows how to print a document containing charts and text mixed together.
Reading and Writing Data as XML
This sample shows how to serialize and deserialize the data of a data source in XML format.
Real-time Updates With Fixed Size Storage

This sample shows how to create a real-time data chart that constantly updates itself, but limits its memory use to a fixed size.
Styling

This sample shows how to apply different style sheets to a chart.
Using a JViews Charts Designer Project File in an Application

This sample shows how to use a Perforce JViews Charts Designer project file in an application.
Using JViews Charts JSF components
This example shows how to use the JViews Charts JSF components to display a chart.