Data Display Classes
The graphical representation of a data source is defined according to the following criteria:

The global characteristics of a chart (for example, whether it uses Cartesian or polar projection)
The rendering type used to display data on the screen (as a polyline, bar, stair, and so on).
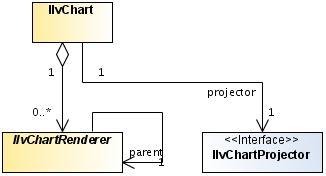
The conversion from data space to screen coordinates is handled by a projector object, which is an instance of IlvChartProjector. The type of a projector object is defined by the type of the chart and is a global parameter of a chart:
A Cartesian projector when using a Cartesian chart.
A polar projector when using a radar, polar, or pie chart.
The way data is rendered on the screen (as a polyline, a bar, or a bubble) is handled by chart
renderer objects, which are instances of subclasses of
IlvChartRenderer.
There are three types of chart renderers:
Simple renderers (instances of
IlvSimpleChartRenderer ).
Data Display Classes Relationship
Composite Renderers
The composite renderers are used to render the contents of a data source using a collection of child chart renderers so that each data set in the associated data source is rendered by one of these child renderers.
Depending on the rendering type, the relation between a data set and a child renderer can be one of the following relations:
unary relation: one child renderer per data set.
The unary relations are handled by instances of subclasses of IlvSimpleCompositeChartRenderer. An example of a simple composite chart renderer is the polyline renderer, which renders each data set of the data source by a polyline.
n-ary relation: one child renderer using several data sets.
The n-ary relations are handled by direct subclasses of IlvCompositeChartRenderer. An example of a composite chart renderer that uses several data sets for one graphical representation is the high-low renderer (hilo), which needs two data sets (high and low values) for one graphical representation.
Single Renderers
Single renderers are used as elementary chart renderers by composite renderers to draw the graphical representation of data sets. While a composite renderer handles a data source, a single renderer handles a data set. Single renderers can also be used directly when you handle a specific data set.
Simple Renderers
Simple renderers are used to render the contents of a data source. They do not make use of other renderers for particular data sets. Instead, they do the rendering all on their own.
Copyright © 2018, Rogue Wave Software, Inc. All Rights Reserved.