Data Projection
Data Projection is the process of mapping data points provided by the data model into display points used by chart renderers. This mapping corresponds to a conversion between two coordinate systems:
The data space, which defines the coordinate system where data is expressed. This coordinate system is defined by chart coordinate axes.
The display space, which defines the coordinate system where data points are projected. This coordinate system is equivalent to the user space in Java2D terminology. In other words, it corresponds to the coordinate system used by rendering routines.
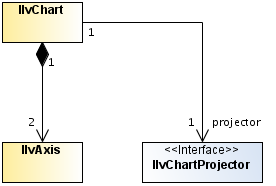
Data Projection Classes Relationships
Chart Axis and Chart Projector
Each chart uses several coordinate axes, which are represented by the IlvAxis class.
The conversion between data space and display space is performed by a projector owned by the chart. Depending on its type, a chart uses one of the two predefined projectors available in the Charts package:

Cartesian projector
Polar projector
The projector used by a chart can be retrieved with the IlvChart.getProjector method.
Copyright © 2018, Rogue Wave Software, Inc. All Rights Reserved.