Creating Gantt charts from templates
A
template is a predefined project with a
style sheet designed for a specific type of application or style of presentation. It includes an appropriate
data model and some sample activities, resources, constraints, and reservations with
user-defined types. You can use a template as a starting point for a Gantt chart.
When you use the New Gantt Chart Wizard, you can create a Gantt chart by loading your data and applying basic settings, or you can load a template.
1. To start a new chart based on a supplied template, choose File > New from Wizard. The New Gantt Chart Wizard starts.
The following figure shows how to choose the template option.
1. 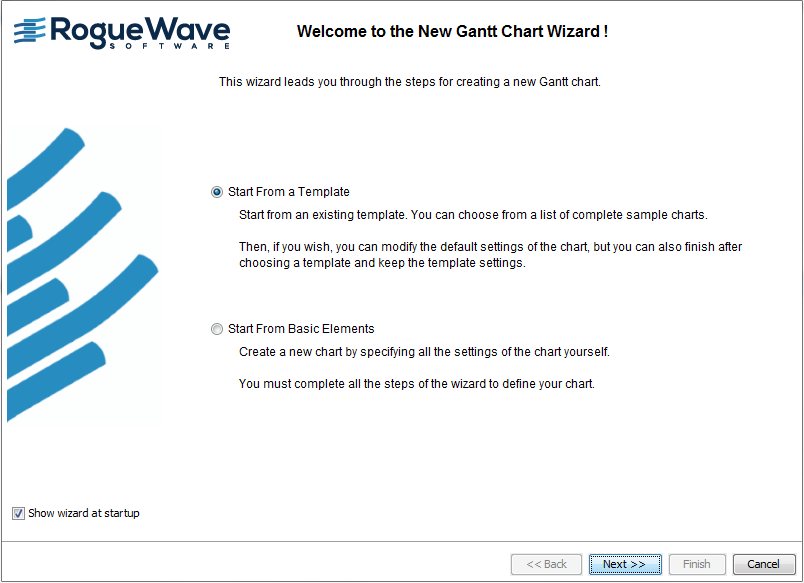
2. Select the option to start from a predefined template.
The following templates are available:

Basic Gantt Chart
Basic Schedule Chart
Gantt Status Chart
Schedule Chart for Plant PowerOps
Schedule Chart for Transportation Planning
These templates reflect typical uses of JViews Gantt. Each may have different styling options and different default styles for data.
3. Click Next and choose the Gantt Status Chart.
The Gantt Status Chart template is an enhanced activity-oriented chart which includes the completion attribute in the data and the user-defined type critical. If you click Finish, you will have an activity-oriented chart that displays critical activities in red and shows the percentage completion as a narrow bar along the center of the activity bar.
The following figure shows an enhanced activity-oriented chart with template data.
4. 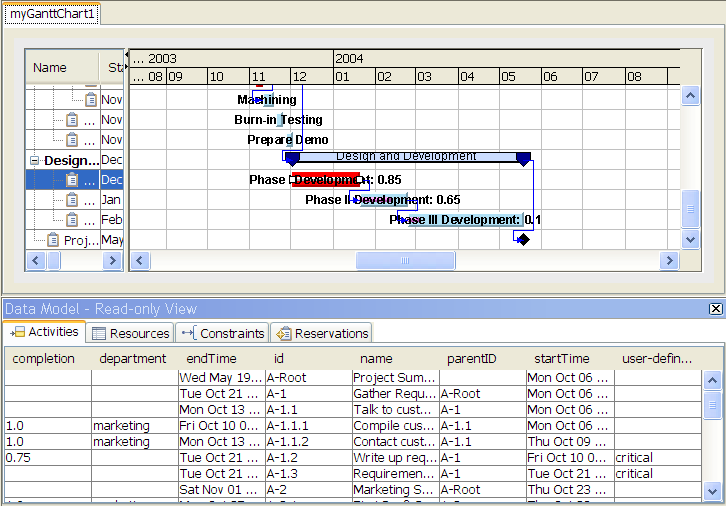
Note that the chart is shown in Chart Editing Mode with the data model read-only view.
Copyright © 2018, Rogue Wave Software, Inc. All Rights Reserved.
