The process flow
The main phases in the recommended process of developing a chart with JViews Gantt are:
1. Populating the data model with your application data.
2. Creating a chart with the Designer.
3. Developing the Java® Swing application or servlet that uses the chart component.
4. Customizing the application.
When you start a development project, you usually go sequentially from one phase to the other to create a first prototype. Once the prototype is ready, you will probably concentrate on each phase in turn, using a classical incremental development approach.
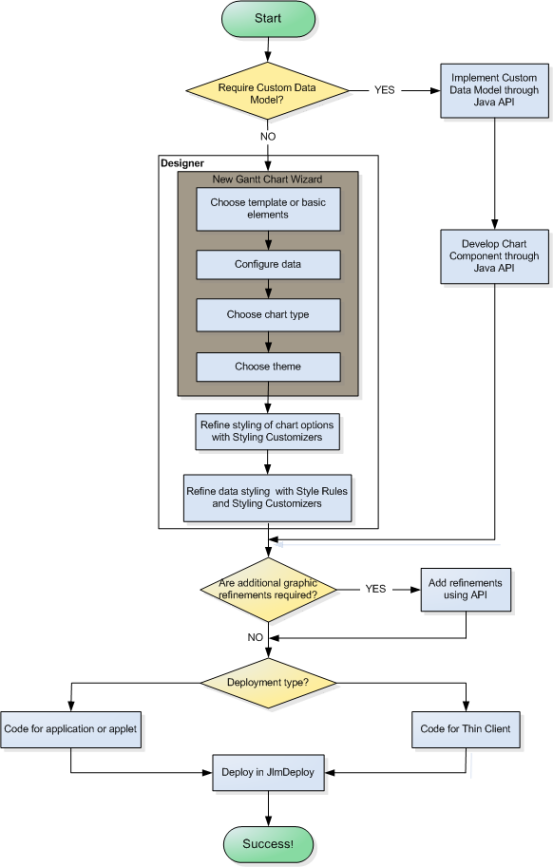
The following figure shows the process flow for building a chart component in Rogue Wave®JViews Gantt.
The figure presents a high-level view of the overall process.
The detailed tasks belonging to each step are described in the user documents:

Using the Designer.
Developing with the
JViews Gantt SDK.
Unless otherwise specified, all the steps of the process flow can be carried out through the Designer and are documented in Using the Designer.
You can develop a Gantt chart from scratch or by connecting to existing data, with the Designer. Working with the Designer, you develop components entirely through the GUI of the Designer. The only code you need to write is to integrate your component into an application or to deploy an application as a thin client.
Copyright © 2018, Rogue Wave Software, Inc. All Rights Reserved.