Graphical representation
JViews Gantt features high-level beans, called Gantt chart bean, Schedule chart bean, and Resource Data chart bean. Their API is based on the classes
IlvGanttChart,
IlvScheduleChart, and
IlvResourceDataChart.
The beans encapsulate the Gantt library. Together with the Gantt data model, these beans make up the main classes for handling Gantt, Schedule, and Resource Data charts in JViews Gantt. Chart beans have a similar architecture and have many properties and attributes in common.
The Gantt and Schedule charts are implemented by the
IlvGanttChart and
IlvScheduleChart classes, respectively, both subclasses of
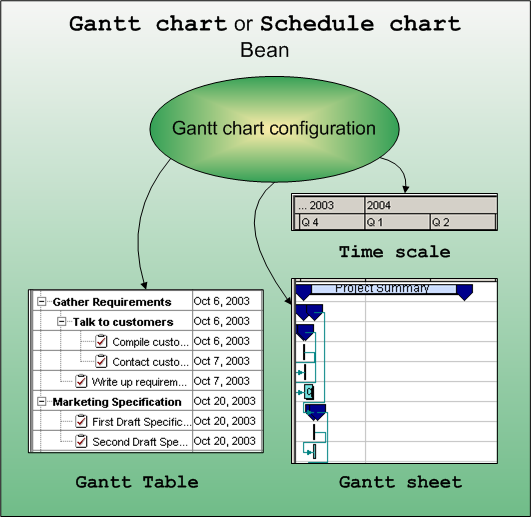
IlvHierarchyChart. The Gantt chart and Schedule chart beans can be described as a predefined combination of a configuration, a table, a Gantt sheet, and a timescale. The Gantt configuration coordinates the display of the predefined user-interface components. With the
JViews Gantt SDK you can rearrange, extend, or add to your Gantt display based on the predefined bean.
The following figure shows how the Gantt chart and Schedule chart beans can be described as a predefined combination of a configuration, a table, a Gantt sheet, and a timescale.
The Resource Data chart bean is based on the
IlvResourceDataChart class, which is a subclass of
IlvScheduleDataChart. The bean encapsulates the Gantt and Charts libraries. Together with the Gantt data model, the bean is the main class for handling Resource Data charts in
JViews Gantt.
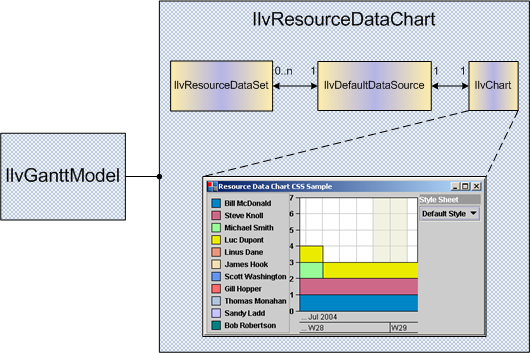
The Resource Data chart displays numerical information derived from the resources in a Gantt Data model. The default data displayed by the chart is the number of activities reserved by a resource at each point in time. We call this data resource loading. The Resource Data chart displays the numerical information as a standard Cartesian chart, where the x-axis represents time. The Resource Data chart provides an alternative view of the data contained in a Gantt data model and complements the displays provided by the Gantt chart and Schedule chart beans.
The Resource Data chart makes use of the rendering capabilities of the IlvChart class from the Rogue Wave® JViews Charts library. The IlvChart class is encapsulated by IlvResourceDataChart, which exposes a relevant subset of the API of IlvChart. See the documentation of Rogue Wave JViews Charts.
The following figure shows the basic architecture of the IlvResourceDataChart bean.
Copyright © 2018, Rogue Wave Software, Inc. All Rights Reserved.