Using the JavaBeans with an IDE
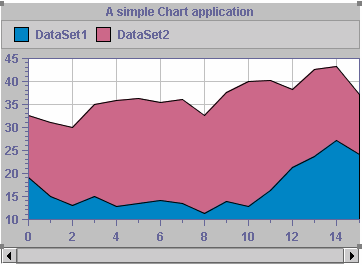
The application loads the data from an XML data file, and displays it in a Cartesian chart by means of an area renderer. The zooming and panning support will also be added to allow the user’s interaction on the chart.
In this section it is assumed that:

You have successfully added the JViews Charts JavaBean to your IDE.
For more information on installing new JavaBeans in the IDE, refer to the documentation of your IDE.

The IDE is configured to use the JViews Charts library. In particular, this example requires that the JAXP library (
jaxp.jar and
crimson.jar ) is accessible.

You are familiar with the manipulation of JavaBeans.
The following example is developed using Borland® JBuilder®. For other IDEs the procedures are the same.
For clarity, the project creation step has been ignored, which is too IDE-dependent.
Loading the data model.
1. Display the JViews Charts beans on the beans toolbar.
2. Click the
IlvXMLDataSource bean icon

, and add it to your project.
This component is a non-GUI JavaBean, and it should not appear in the GUI design interface.
3. Select the data source bean, and edit the filename property to enter the data file location.
For this example, the file can be found in <installdir>/jviews-charts/samples/basic/webpages/data.xml.
At this time, the data source has loaded the data from the XML data file.
Creating the chart.
1. Check that the main frame of the application has a BorderLayout instance as layout manager.
2. Display the JViews Charts beans on the toolbar

.
3. Click the IlvChart bean icon, and then click inside the main frame of your application.
At this point, an IlvChart bean instance is created and displayed inside the frame (Note that a default data model is created at design time).
4. Check that the IlvChart bean is added to the frame with the CENTER constraint.
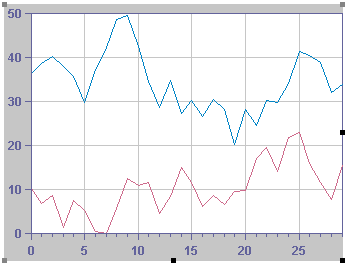
The main frame of our application should appear as in
Beans (1) (since data is created randomly, the data model may differ).
Beans (1)
Connecting the data source.

Select the
IlvChart beans in your frame, and edit the
datasource property to select the instance of the
IlvXMLDataSource you have just created.
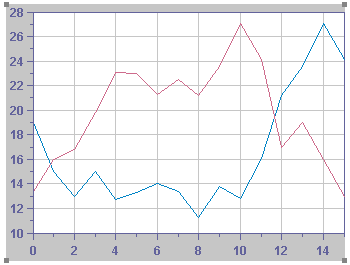
The chart displays the data model contained in the data source, and appears as in
Beans (2):
Beans (2)
Configuring the chart.
Now that the IlvChart is created, you are going to modify its appearance as follows:

Represent the data model by means of an area renderer.

Activate/enable the anti-aliasing mode.

Add a legend on top of the chart area.

Add support for zooming and panning the user’s interactions.

Add a title to our chart.

Add a horizontal scroll bar to our frame to be able to scroll the visible range of the chart in addition to the pan interactor.
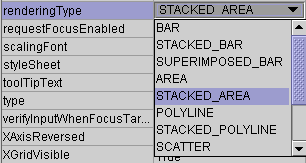
1. From the property list, edit the renderingType property and choose STACKED_AREA in the combination box.
Beans (3)
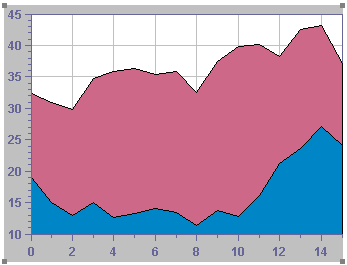
The IlvChart appears now with area renderers.
Beans (4)
2. Set the antiAliasing property to true.
3. Set the legendVisible property to true.
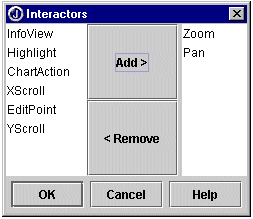
4. From the property list, click the Interactors editor property (usually accessible by clicking a “...” button).
5. In the Interactors property editor, add the Zoom and Pan interactors:
Beans (5)
6. Set the header property to “A simple Chart application”.
7. From the Swing component palette of your IDE, select a JScrollBar and add it to the frame with a SOUTH layout constraint.
8. Select the scroll bar bean, and set its orientation property to HORIZONTAL.
9. Select the chart bean, and edit its XScrollBar property to select the scroll bar instance that you have just created.
Our application is now completed and ready to be run. The frame should appear as follows:
Beans (6)
Check that all the required Java™ libraries have been added to the project class path, compile the project, and run it.
Copyright © 2018, Rogue Wave Software, Inc. All Rights Reserved.
 , and add it to your project.
 .
.