Creating a basic polar chart
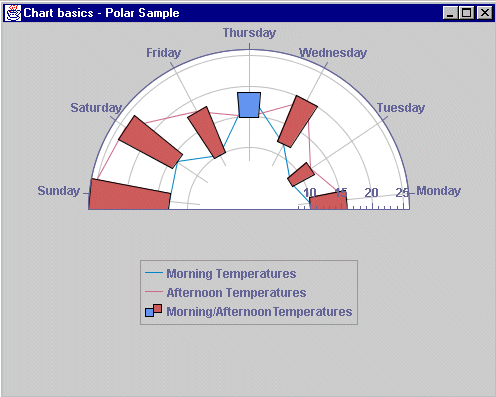
You are going to create a polar chart to represent the morning and afternoon mean temperatures. The days of the week will be represented along the abscissa and the temperatures along the ordinate. The abscissa values will be mapped along a circular scale and the ordinate values will be displayed radially. You will customize the scales and finally, you will add a legend to the chart.
Example Polar Chart
Creating the Data Model

Create the data model and put the data to be displayed into the data source. Use the same data and procedures as for the Cartesian chart example. See
Creating the data model.
Creating a Polar Chart
1. To create a polar chart, use the following code:
IlvChart chart = new IlvChart(IlvChart.POLAR);
chart.setAngleRange(180);
2. Create an instance of
IlvChart, and pass the
IlvChart.POLAR type constant as parameter to the constructor.
3. Set the angle range to 180 degrees, specifying the angle range within which the data will be projected on the screen.
Creating and Adding the Renderers
Copyright © 2018, Rogue Wave Software, Inc. All Rights Reserved.
