Decorations
A chart can have the following decorations:

Data indicators
Data indicators that graphically represent the values of data points or a given data interval in the chart area. For example, you can decorate the chart by highlighting the week-end period using a data indicator which represents a data interval equal to the week-end period. The indicators are of the following type:
| A range indicator along the x-axis. |
| A range indicator along the y-axis. |
| A value along the x-axis. |
| A value along the y-axis. |
| A data window. |

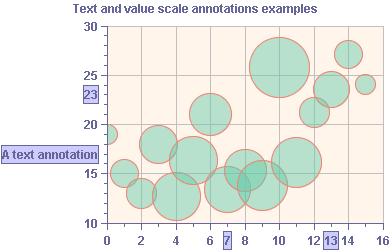
Annotations that display the values on a scale.

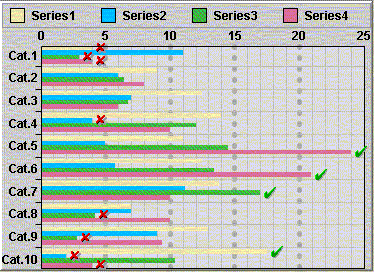
Labels linked to given data points.

An image within the plotting area of the chart.
An image can be drawn according to three different modes:

TILED: The image is drawn as a replicated pattern in the plot area.

SCALED: The image is scaled so that it fills the plot area.

ANCHORED: The image is drawn at a fixed position.
Decorations are drawn according to a drawing order. The drawing order lets you control the position of a given decoration in the drawing queue of a chart.
Decorations are handled as an ordered list according to the decorations drawing order: decorations with the lowest drawing order are drawn first, decorations with the highest drawing order are drawn last.
Copyright © 2018, Rogue Wave Software, Inc. All Rights Reserved.


