Don't miss these features
Rogue Wave JViews Charts offers a wide range of features for helping user interface developers create state-of-the art displays. These include:

Designer for
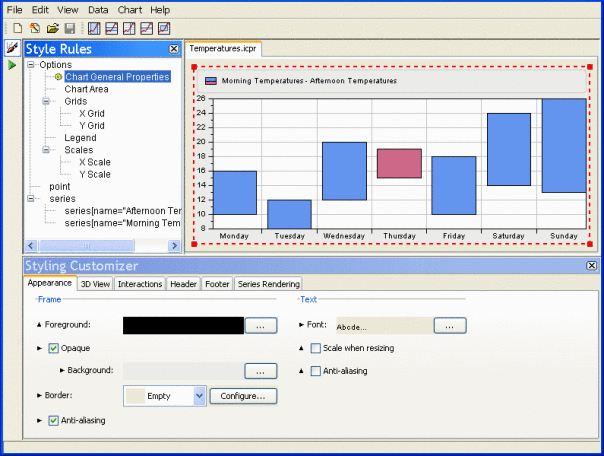
JViews Charts, a point-and-click editor for specifying most aspects of the display, including the data source and the "rules" for defining how the chart will appear on the screen under different data conditions;

Runtime customizability of views, to let users change the appearance of the chart display in order to improve insight or reflect a personal preference;

A full spectrum of charts display types, including XY, bars, pie, bubble, financial, stacked, and many more types of charts that can be displayed in 2D and 3D

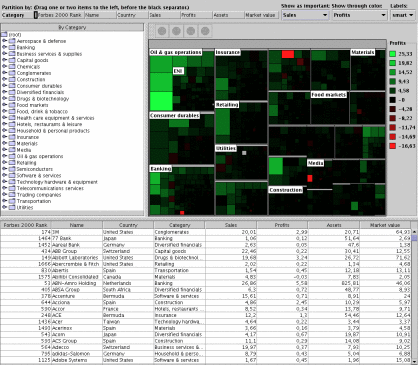
A treemap view, an innovative approach to viewing large quantities of data, helping users better analyze and understand the data;

Advanced display services, including video-like zooming and scrolling, automatic scale adjustment, multiple scales, real-time updating, load-on-demand for large data sets, dynamic styling and so on;

Easy thin-client deployment, using Ajax-enabled Java Server Faces that drastically reduces the complexity of writing interactive charts for the Web. These JSF components are available as both DHTML and SVG clients. (The SVG clients especially well-suited for real-time updates.)

A powerful Swing-like model-view-controller (MVC) architecture, providing clear separation between data and its screen representations, automatic notifications, and view synchronization; and

A full-featured SDK, for the ultimate control in customizing all aspects of the chart display and interaction.
Copyright © 2018, Rogue Wave Software, Inc. All Rights Reserved.

