Supported features
Describes the features currently supported by a chart using 3-D rendering.
Describes the chart renderers that can be displayed by a 3-D chart.
Describes the two predefined chart decorations.
Describes the interactions that can be used with a 3-D chart.
Lists some noteworthy operations that are not currently supported by 3-D Charts.
Available chart renderers
Several objects in the JViews Charts library implement the IlvChart3DSupport interface and provide the has3DSupport method to query whether 3-D is handled:
-
Drawable objects (scales, grids, and decorations)
-
Renderers
-
Interactors
The supported features are only a subset of what is available for 2-D charts.
Once the chart is set to 3-D, all graphical elements that do not support 3-D are discarded during the rendering process. Likewise, events are not dispatched to the interactors that do not work with 3-D charts.
You can combine several Cartesian representations (bar, line, area and stair) within a single chart. More information on chart renderers can be found in Handling chart renderers.
Bar Charts
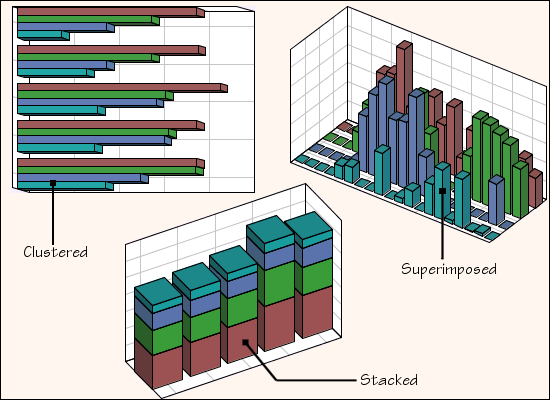
The following 3-D bar charts representations are supported:
-
Superimposed bars.
Each series is displayed in a separate layer along the depth axis. The getZAnnotationText method returns the text that must be displayed next to each layer.
-
Clustered bars.
Bars are laid out in clusters on the same layer. No layer annotation is specified.
-
Stacked bars.
Bars are stacked on the same layer. No layer annotation is specified.
3-D Bar Charts shows some examples of 3-D bar charts.

3-D Bar Charts
Line, Area, and Stair Charts
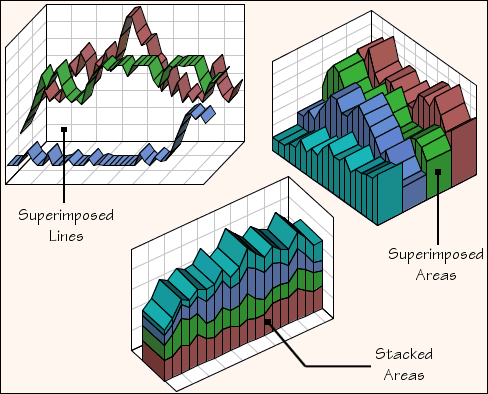
The following continuous representations are supported:
-
Superimposed line, area, or stair charts.
Each series is displayed in a separate layer along the depth axis. The getZAnnotationText method returns the text that must be displayed next to each layer.
-
Stacked line, area, or stair charts.
The entire series is displayed on the same layer. No layer annotation is specified.
3-D Lines and Areas shows some examples of line and area charts.

3-D Lines and Areas
For 3-D line charts, the set3DOutlinePaint method lets you specify the color of the ‘ribbon’ outline.
Pie Charts
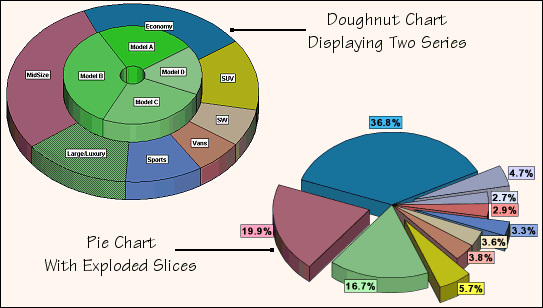
The JViews Charts library supports 3-D pie and doughnut charts. When several series are provided, each one is displayed in a separate layer. As in 2-D, you can also explode slices. 3-D Pie Charts shows some 3-D pie charts.

3-D Pie Charts
Available chart decorations
The JViews Charts library provides two predefined chart decorations:
-
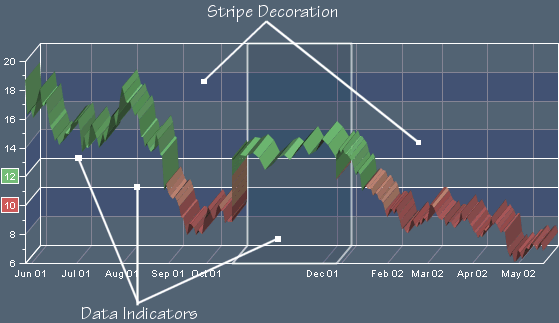
Data indicators, which can also be used with a 3-D Cartesian chart.
-
Image decorations, which are not supported in 3-D.
You can find more information on data indicators in Displaying Data Indicator.
You can also design decorations that can be displayed both in 2-D and in 3-D. For example, the stripe decoration implemented in Stripes.java uses the getShape method. This method returns a different shape depending on whether the chart is displayed in 2-D or 3-D.
Decorations in 3-D shows a chart using the stripe decoration and data indicators.

Decorations in 3-D
Available chart interactions
Besides the interactive control of the 3-D view, the following interactions can be used with a 3-D chart.
-
Picking interactions ( IlvChartPickInteractor). The picking mode must be set to IlvChartData.ITEM_PICKING.
-
Highlighting interactions ( IlvChartHighlightInteractor, IlvChartInfoViewInteractor). The picking mode must be set to IlvChartData.ITEM_PICKING.
-
Scrolling interactions ( IlvChartXScrollInteractor, IlvChartYScrollInteractor).
Interactors that do not work with 3-D charts are simply discarded during the event dispatching process.
Unsupported operations
Trying to perform display to data projection will raise an UnsupportedOperationException. This concerns the following methods: toData, toData, toDataWindow.
Synchronization between the plotting areas of two charts is not supported (see the synchronizeAxis method).
The resizing policy specified by the setResizingPolicy is ignored.
The Line, Area, and Stair chart renderers do not perform clipping along the y-axis. This means that you must make sure that the visual y-range contains all the displayed points. This is usually done by setting the autoVisibleRange property of the y-axis to true, which is the default value.
For the Area and Stair chart renderers, the crossing value of the x-axis is constrained to the minimum or the maximum value of the y-axis.