Rogue Wave JViews TGO Sample: Integration - SNMP
Description
 |
This sample shows how to use the SNMP features of the Rogue Wave JViews TGO predefined business objects.
How to Use the Sample
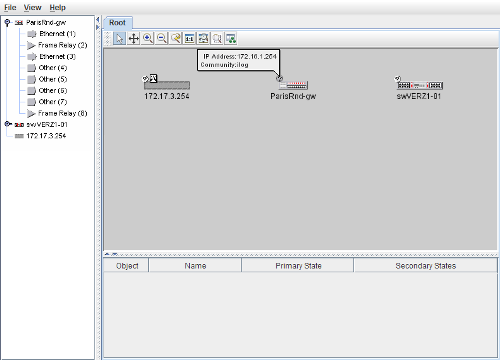
A Network component has a default toolbar which provides a set of predefined interactors: In this sample, a new toolbar button
 is available
allowing you to register new network nodes. These network nodes represent real resources which should be
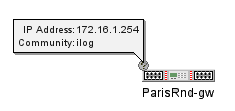
manageable using the Simple Network Management Protocol. To create the network nodes, provide the IP address
of the resource, as well as the community information. You can also specify which type of network element should
be used to represent the resource graphically.
is available
allowing you to register new network nodes. These network nodes represent real resources which should be
manageable using the Simple Network Management Protocol. To create the network nodes, provide the IP address
of the resource, as well as the community information. You can also specify which type of network element should
be used to represent the resource graphically.
For each interface recognized in the node, a network element is created to represent it in the components. This network
element is added as a child of the IP node. The containment relationship can be seen in the Tree component view. Once
the interface node is created, the sample will once again send requests to the SNMP agent to retrieve the following information: To see the interface information for a specific node, expand the node in the Tree component and select one of the interfaces. The interface will then become visible also in the Network and Table components.
How to Run the Sample as an Application
This sample can
be run as an application.
The installation directory contains
an executable JAR file,
integration-snmp.jar,
that allows you to execute the sample with a double click from a
file browser. Note that if you are using Internet Explorer, you can
open the installation directory
and execute the JAR file from the browser. This
technique may not work in other Web browsers.
Alternatively, you
can run the sample application from the command line.
First check that the Ant utility is properly configured. If not, see the
instructions on how to configure Ant for Rogue Wave JViews.
Then, go to the installation directory
of the sample and type:
ant run
Topics Covered
- Integrating the various Rogue Wave JViews TGO graphic components: Network, Table and Tree.
- Browsing relationships using the Tree and the Network components.
- Using filters and origins to limit the objects coming from data sources.
- Applying configuration to components.
- Using actions to share information between components.
- Creating nodes programatically.
- Setting SNMP information.
- Creating new SNMP attributes.
- Loading and saving XML information.
- Using JavaBeans to display trap and log messages in a Rogue Wave JViews TGO Table component.
- Connecting the application with real resources using the Simple Network Management Protocol.
- Using internationalization support with Rogue Wave JViews TGO.
Detailed Description
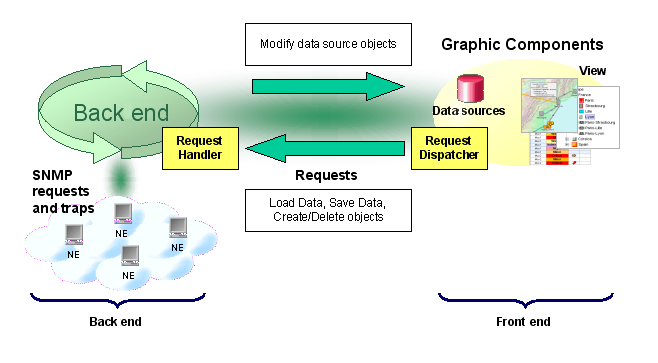
The architecture of this sample is composed of two major parts:
- The front-end consists of different graphic components that display business data, connected to data sources to manage the data. The user can interact with the back-end application through the front-end GUIs.
- The back-end simulates the behavior of a communications network management platform. The back-end application performs the following main tasks:
- Communicates with SNMP agents using an open source SNMP Stack (See SNMP4J Stack). The SNMP4J Stack is an enterprise class free open source stack and the license can be found at SNMP4J license details
- Creates network elements and update object states or statuses that are displayed by the front end.
-
Handles requests issued from the front end.
Requests can be "Add/Remove objects", "Load network data", "Request System Information", and so on.
How to Run an SNMP Agent
This sample assumes that SNMP agents are running in the different nodes that are registered in the data source.- On Windows platforms, SNMP agents can be started by the system administrator. Open the Services dialog from the Administrative Tools panel, select the SNMP agent service and start it.
- On Unix platforms, SNMP agents can be started by the root user. Please contact your system administrator for information.
Installation Directory
The Integration - SNMP sample is installed here.
Classes Involved
-
ilog.tgo.IltSystem
The class that initializes a JViews TGO application.
-
ilog.cpl.IlpNetwork
The network component.
-
ilog.cpl.IlpTree
The tree component.
-
ilog.cpl.IlpTable
The table component.
-
ilog.cpl.model.IlpObject
The business object definition.
-
ilog.tgo.datasource.IltDefaultDataSource
The default datasource implementation.
-
ilog.cpl.model.IlpComputedAttribute
The attribute which is computed based on the value of other attributes.
-
ilog.tgo.model.IltNetworkElement
The network element business class.
-
ilog.tgo.model.IltSNMP
The SNMP state system
-
ilog.tgo.model.IltSNMPObjectState
The SNMP object state
-
ilog.cpl.util.IlpI18NUtil
The internationalization utilities
Source Files
-
snmp.Main
The entry point of the sample.