Rogue Wave JViews TGO Sample: Integration - Monitoring
Description
 |
This integration sample shows how to use Rogue Wave JViews TGO to build a simple network and service monitoring system.
How to Use the Sample
This sample is made up of three modules:
- The Network module
- The Inventory module
- The Service module
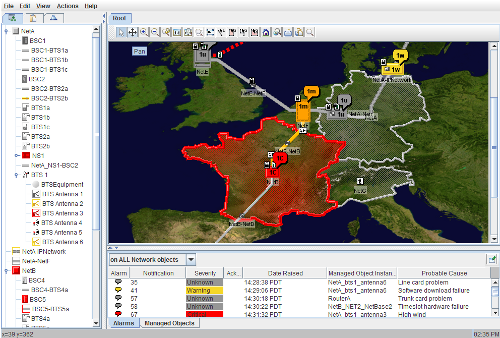
When you launch the sample, the main window appears. This window is composed of three areas:
- A tree area that contains a Swing JTabbedPane with three tabs, each corresponding to one module. To activate a given module, you must click the corresponding tab.
- A table area that contains an "Alarms" table and a "Managed Objects" table. The content of this table varies depending on which module is active.
- A main area that contains a Network or an Equipment component depending on which module is selected in the tree.
How to Run the Sample as an Application
This sample can also be run as an application. The installation directory contains an executable JAR file, integration-monitoring.jar, that allows you to execute the sample with a double click from a file browser. Note that if you are using Internet Explorer, you can open the installation directory and execute the JAR file from the browser. This technique may not work in other Web browsers.
Alternatively, you can run the sample application from the command line. First check that the Ant utility is properly configured. If not, see the instructions on how to configure Ant for Rogue Wave JViews.
Then, go to the installation directory of the sample and type:
ant run
Topics Covered
- Integrating the various JTGO components: Network, Equipment, Table and Tree.
- Browsing relationships using the Tree and the Network Components.
- Using filters and origins to limit the objects coming from the data sources.
- Applying configuration to components.
- Using actions to share information between components.
- Creating objects programmatically.
Detailed Description
This integration sample shows how to use Rogue Wave JViews TGO to build a simple network and service monitoring system.
Common Interactions
The following interactions are available in some or all of the windows:
- Pop-up menu: Clicking the window with the right mouse button displays a contextual menu.
- Zoom In: Zooms in on the main area.
- Zoom Out: Zooms out on the main area.
- Zoom Back: Restores the previous level of zoom.
- Reset Zoom: Resets the transformer factor of the main area.
- Fit to Contents: Modifies the transformer of the main area to show all the objects.
- Overview: Displays an overview window of the main area.
- Select All: Selects all the objects in the main area.
- Show Table: Displays the table area in a separate window.
- Show Log Trace: Displays the log trace in a separate window.
- Print/Preview Print: Prints/gives a preview of the image in the main area.
- This feature is implemented using the Rogue Wave JViews Printing Framework.
Network Module
This module provides "Network Management" functionality.
Features Used
- Default behavior of the Tree Component.
Displays a network as a tree structure. The tree root is the root network. - Default behavior of the Table Component.
Displays all the network objects in a table format. - Default behavior of the Network Component.
Displays a topological view of a subnetwork.
Special Interactions
- Expand a subnetwork:
You can double click, or select "Drill Down" pop-up menu, on a tree node or on a network group node (a rectangle- , polygon-, or polyline-shaped node) to open a network or a subnetwork in the main area. - Show Parent Network:
You can select "Back to Parent" pop-up menu on an empty space in the main area to go back to the parent network after a subnetwork was expanded. - Show Related Services:
You can select "Show Services" pop-up menu on a node to display the possible services it belongs to. - Show Equipment Details:
You can double click, or select "Drill Down" pop-up menu, on a network element node to load its equipment details. - Locate an object:
When you select a tree node, the corresponding graphic objects are selected in the Network and Table components. When you select a row in a table, the corresponding object is made visible and selected in the Network Component. - Delete selected objects:
You can either choose "Delete" from the pop-up menu or press "Delete" on the keyboard. - Create objects:
You can create objects only in the main area. To do so, select one of the Creation Interactor buttons from the toolbar, and then use the mouse to create the objects. To create network elements, use the option from the pop-up menu of the main area. - Open the root network:
You can either click in the toolbar, or click in the tree area outside of any node to open the root network in the main area.
Inventory Module
This module provides "Inventory Management" functionality.
Features Used
This module uses the same features as the Network module and includes the following additional functionality:- User-defined dynamic classes
The class named "EquipmentVendor" is a user-defined dynamic class. It is used to organize entries in the Tree Component. - Default behavior of the Equipment Component
Special Interactions
- Show Network View:
You can select "Back to Network View" pop-up menu on an empty space in the main area to go back to the network view.
Alarm/Object State Monitoring
The back-end simulator generates alarms/object states periodically. Alarm instances are displayed in the "Alarm table" underneath the main area. When the Network module is active in the main area, those alarms and object states also appear on network objects as alarm balloons or small icons.
Features Used
- Update business objects dynamically
- Customize style sheet for rendering alarm objects
Special Interactions
- Acknowledge Alarms
You can select from the toolbar in the Alarm table to acknowledge the selected alarms.
 - Remove Alarms
You can select from the toolbar in the Alarm table to clear the selected alarms.
Log Trace
This application also implements the log trace mechanism. Log messages are reported in a separate window called the "Log Viewer".
Features Used
- Define a style sheet for a JavaBean
- Add a JavaBean to the data source
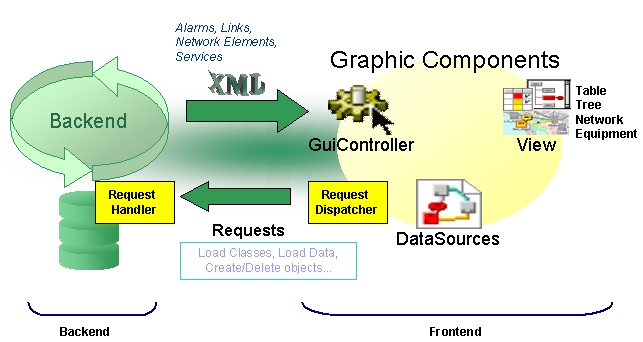
Architecture of the Application
The architecture of this sample is composed of two major parts:
- The front end consists of different JTGO graphic components that display business data, connected to data sources to manage the data. The user can interact with the back-end application through the front-end GUIs.
- The back end simulates the behavior of a communications network management platform. The back-end application performs the following main tasks:
-
- Generate alarms.
- Update objects states or statuses that are displayed by the front end.
- Handle requests issued from the front end.
Requests can be "Add/Remove objects", "Load network data", "Request System Information", and so on.
The illustration below gives an overview of the application architecture:
Installation Directory
The Integration - Monitoring sample is installed here.
Classes Involved
-
ilog.tgo.IltSystem
The class that initializes a JViews TGO application.
-
ilog.cpl.IlpNetwork
The network component.
-
ilog.cpl.IlpTree
The tree component.
-
ilog.cpl.IlpTable
The table component.
-
ilog.cpl.model.IlpObject
The business object definition.
-
ilog.tgo.datasource.IltDefaultDataSource
The default datasource implementation.
Source Files
-
monitoring.Main
The entry point of the sample.