Rogue Wave JViews Diagrammer Sample: Creating Custom Graphics using the SDK
Description
 |
This sample shows simple custom graphics that are made dynamic by changing properties in the data model.
How to Use the Sample
- Use the Reset button
 to recreate a model.
 - Use the Play button
 to run the simulator.
 - Use the Pause button
 to stop the simulator.
 - Use the slider to accelerate the simulation.
- Click a turning object to park it.
- Click a parked object to unpark it.
How to Run the Sample as an Application
This sample can also be run as an application. The installation directory contains an executable JAR file, customgraphics.jar, that allows you to execute the sample with a double click from a file browser. Note that if you are using Internet Explorer, you can open the installation directory and execute the JAR file from the browser. This technique may not work in other Web browsers.
Alternatively, you can run the sample application from the command line. First check that the Ant utility is properly configured. If not, see the instructions on how to configure Ant for Rogue Wave JViews.
Then, go to the installation directory of the sample and type:
ant run
Topics Covered
- Using the diagram component to create nodes in a model.
- Creating a simple CSS file to bind nodes and their graphic representation, to bind some of their properties with properties of the graphic class, to add an interactor on the nodes, and to define the properties of a link.
- Writing a simple graphic component to represent the nodes.
- Writing a simple interactor.
Detailed Description
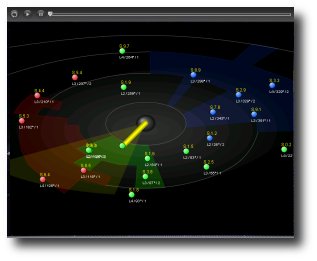
Several objects, which could be space vehicles, turn around an alien artefact at different orbits and speeds.
The identifier and the position of each vehicle are displayed respectively above and below the vehicle's icon. Red, blue, and green areas around the artefact represent dangerous areas. When a vehicle enters one of these areas, its color changes to match the color of the area.
The artefact emits a kind of radar signal. From time to time, it captures a vehicle that is in its radar area and brings it closer to itself, step by step. When the vehicle finally enters the "dead zone", it becomes black.
You can park a vehicle by clicking it. It will quit its trajectory and move to the bottom right corner of the view where it enters the queue of parked vehicles. To unpark a vehicle, just click it and it will be put back into orbit.
Explanation
This demo creates an instance of a diagram component and the Swing GUI. Then it loads an IVL file containing some graphic objects that represent the dangerous areas and the artefact. These will be used later during the simulation.
A random number of nodes is created in the diagrammer model to represent the vehicles.
Nodes
The nodes are instances of the Node class which extends IlvDefaultSDMNode. We added some members to this class in order to store data used for positioning and animating the nodes in the view. As the nodes get animated on a elliptical trajectory, each node has an orbit, an angle, and a rotation speed (in degrees/animation step).
Graphical Representation of Nodes
To graphically represent the nodes, we have created a custom class which extends IlvGraphicSet and is made of the following components:
- A central icon which changes according to a "color" property.


- A text above the icon which displays the symbol identifier and changes according to the "label" property.
- A text below the icon which displays location information and reflects the "position" property.
A CSS file associates the nodes of the model with the custom graphic class. It also defines the link object used to capture the vehicles.
Simulation
Before starting, the simulation sets the stylesheet (the CSS file) used by the model. When the model is ready, the simulation can start.
It mainly consist in a timer performing an animation every n ms.
During each step, several operations are performed to change the properties of the nodes:
- Moving the nodes
Each node moves according to the value of its "action" property:
- Turning around the artefact. This is done by changing its "x" and "y" property. The "position" property is also updated.
- Moving to the parking area.
- Leaving the parking area.
- Checking the position of each node during the move. If the node is contained in one of the three dangerous areas, its "color" property changes to "red", "blue", or "green".
- A node is randomly chosen among all the nodes in the radar area; it becomes the target of the artefact.
- If a target has been chosen, a link between the artefact and the target is created and added in the model.
- If a link has been created, the orbit of the target is modified step by step to bring the target closer to the artefact.
When a predefined orbit is reached (the "dead zone"), the link disappears and the color of the target is set to black.
We have seen that a node has an "action" property which defines the way it moves. This property can have three different values: "turning", "parking", or "unparking". This value changes when clicking the node. By default, all nodes turn around the artefact. When clicking a turning node, you change its "action" from "turning" to "parking". When clicking a parked node, you change the "action" to "unparking".
Clicks are detected by an interactor. Only the nodes representing a vehicle respond to this interactor. It is set in the CSS file. A class named Interactor manages the clicks.
Installation Directory
The Creating Custom Graphics using the SDK sample is installed here.
Classes Involved
-
ilog.views.diagrammer.IlvDiagrammer
The main class of the diagram component.
Source Files
-
CustomGraphics
The entry point of the sample that creates the simulation and the associated Swing code.
-
Simulator
A class that creates some customized graphic objects and then uses knowledge of the data model to make these objects dynamic.
-
Node
An extension of default nodes that are created in the model.
-
Graphic
An extension of
IlvGraphicSetthat is used to represent the nodes of the model in the view. -
Interactor
A sample of interactor that can be added on nodes.