Creating a chart customizer
It may happen that you need to modify the appearance of your chart at run time. To do this, you can adopt one of the following solutions:

Load different predefined style sheets.
Use chart customizers, that is, interactive GUI components that allow you to handle the parameters of the chart appearance.
chart customizer
Rogue Wave® JViews Charts provides predefined chart customizers that can be customized and easily integrated into a JViews Charts application. These chart customizers are based on the CSS styling technology of the chart. Therefore, it is possible to create an application that:
loads one or multiple style sheets to customize the chart,
fine-tunes the customization after styling by using the interactive chart customizers.
To create a chart customizer:
1. Import the following packages to create a chart:
2. Import the packages that contain the customizer framework for JViews Charts:
3. Create the chart and load your style sheet:
IlvChart chart = new IlvChart();
try {
chart.setDataSource(...);
chart.setStyleSheets(...);
} catch (ilog.views.util.styling.IlvStylingException x) {
...
}
4. Create the chart customizer associated with this chart.
IlvChartCSSCustomizerPanel customizer =
new IlvChartCSSCustomizerPanel(chart);
5. Create the chart customizer panel.
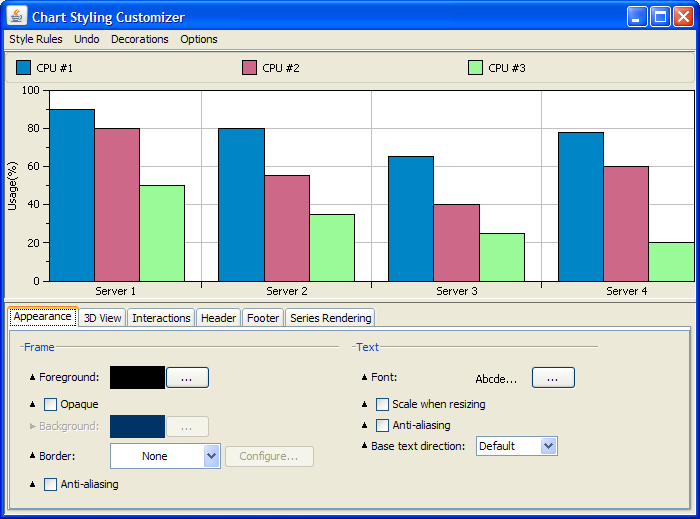
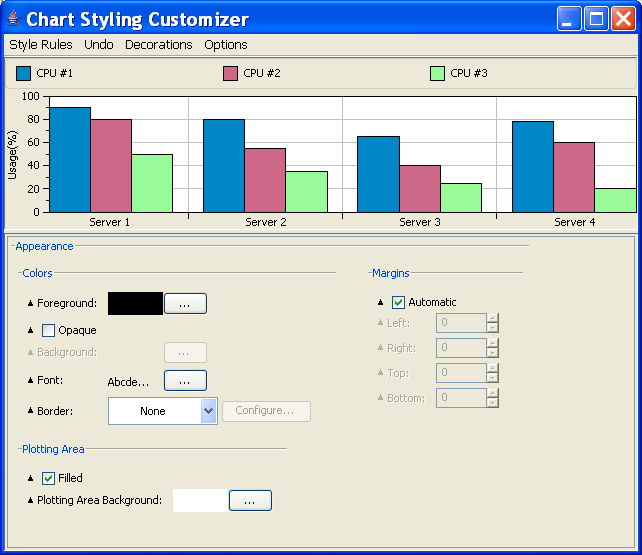
The chart customizer panel is a JPanel. It can be displayed in a dialog or in a frame or it can be added to a JComponent. In this example, you are going to display it in a split pane.
Make the chart appear in the upper part of the split pane and the chart customizer in the lower part:
JSplitPane splitPane = new JSplitPane(JSplitPane.VERTICAL_SPLIT);
frame.getContentPane().add(splitPane, BorderLayout.CENTER);
splitPane.setTopComponent(chart);
splitPane.setBottomComponent(customizer);
6. Set the style rule that will be handled by the chart customizer:
customizer.setRule("chartArea");
In this case, the chart customizer shows all the controls (buttons, fields, and boxes) that allow you to customize the chart area interactively. The parameter passed to the method setRule of the chart customizer is the selector of a style rule.
Possible values are: chart, chartArea, chartLegend, chart3Dview, chartScale, chartGrid, series, point.
Complex selectors such as chartScale[axisIndex="-1"] are also allowed, provided that the chart actually has such a scale.
You can find more details about selectors in
Styling the Chart Component.
These steps are sufficient if you want to reuse the predefined chart customizers. Otherwise, you can modify the chart customizers according to your needs. For more details, see
Customizing the chart customizer.
NOTE A chart customizer for treemaps is currently not available.
Copyright © 2018, Rogue Wave Software, Inc. All Rights Reserved.