Reconfiguring your data source
If you have an existing chart, but you want to include further data from the same data source, or try out a new data set, you can reconfigure the data associated with the chart.
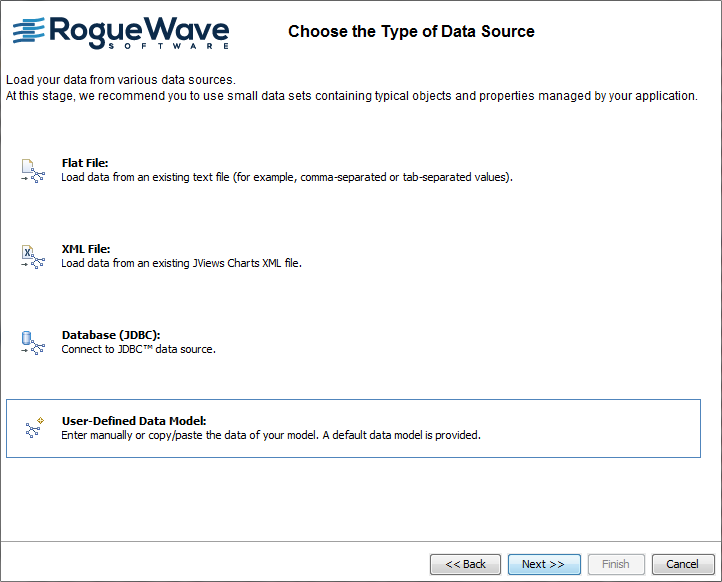
1. With your project TemperaturesCartesianChart.icpr open, choose Data>Reconfigure Data. The New Chart Wizard opens at the Data Source Type page.
2. From the list of data sources, choose User-Defined Data Model, then click Next.
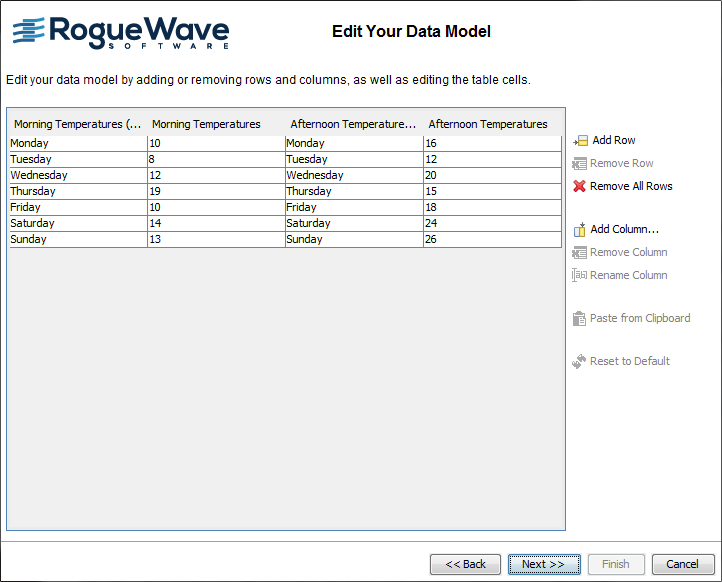
The window Edit Your Data Model presents the current model connected to the chart as a table. From here, you can add or remove row and columns, clear all the data or reset the model to the default value.
You are going to update the temperatures values with new values. Note that you want to keep the name of the days, so the label columns remain unchanged.
3. Select the first cell of the column Morning Temperatures to change the value from 10 to 3. Press Enter to validate.
4. Select the second cell of the same column to change the value from 10 to 1. Press Enter to validate.
5. Repeat this operation for each cell of the column Morning Temperatures as well as for the cells of the column Afternoon Temperatures to obtain the following data model:
Morning Temperatures | Afternoon Temperatures |
3 | 8 |
1 | 11 |
-3 | 5 |
4 | 9 |
6 | 13 |
5 | 9 |
6 | 11 |
6. Once all the values have been entered, click Next to continue.
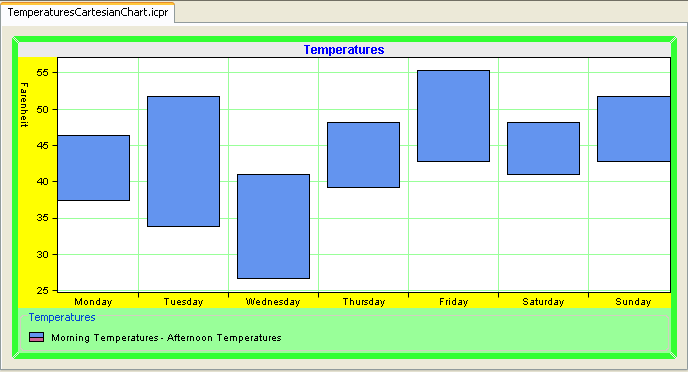
7. In the window Define the Data Mapping, leave the default mapping and click Finish.
Your chart displays the morning temperatures and afternoon temperatures according to the new values you have just entered.
Copyright © 2018, Rogue Wave Software, Inc. All Rights Reserved.