Supported graphical representations
JViews Charts supports ten different types of graphical representation:

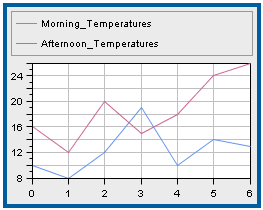
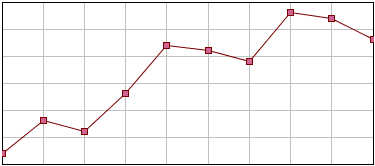
Polyline
A single polyline renderer can draw an additional marker for each data point, for example a square marker, as illustrated below:
By default, the style of the marker is computed according to the style of the renderer, but you can also specify a rendering style of the marker symbol.
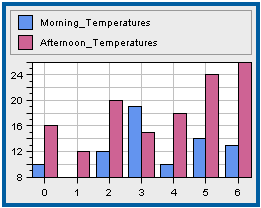
Bar
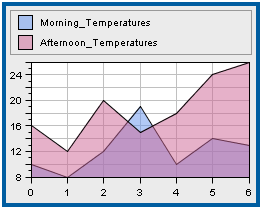
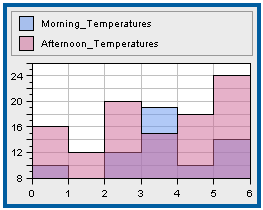
Area
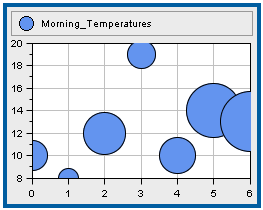
Bubble
A bubble chart represents a two-dimensional data model as bubbles of variable size. The data model should be described by two data sets, the first data set determining the location of the bubbles, and the second data set determining the size of the bubbles.
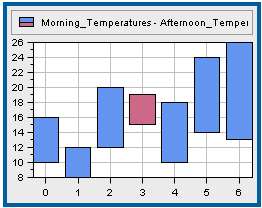
High-Low
The High-Low graphical representation renders two data sets with first and second items and defines two rendering styles:
rise style
Used to draw the high-low items for which the corresponding first value is less than the second value.
fall style
Used to draw the high-low items for which the corresponding first value is greater than the second value.
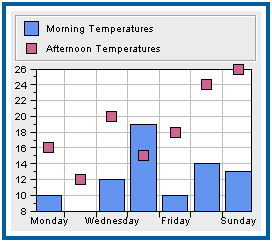
Scatter
The Scatter render represents a data set with scattered graphical markers.
Stair
The Stair renderer represents a transition between two values as a stair instead of straight lines.
Combo
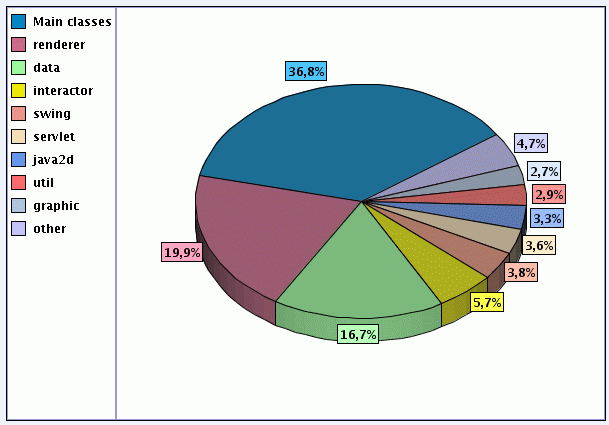
Pie
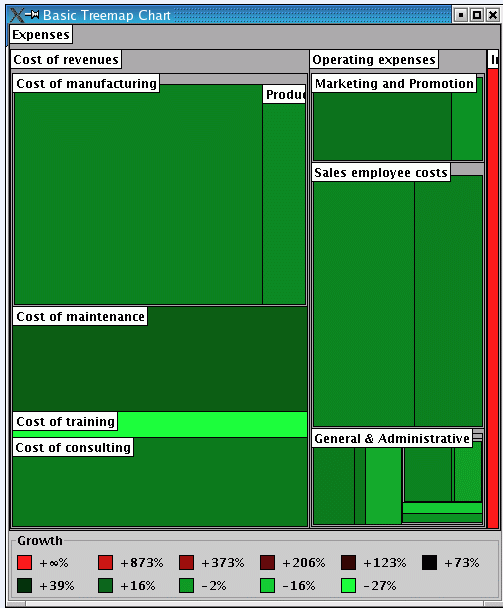
Treemap
Copyright © 2018, Rogue Wave Software, Inc. All Rights Reserved.