What is a chart
A chart represents data graphically in different forms (markers, lines, bars, and so on) with
scales that are added to indicate the values of the displayed data.
JViews Charts allows you to display data in charts that can be customized in various ways, and to interact with these charts in different manners. JViews Charts has been designed for optimum performance coupled with a clean object architecture that makes it the best solution for handling large and/or dynamic data models such as real-time supervision system applications.
JViews Charts provides a wide range of displays:

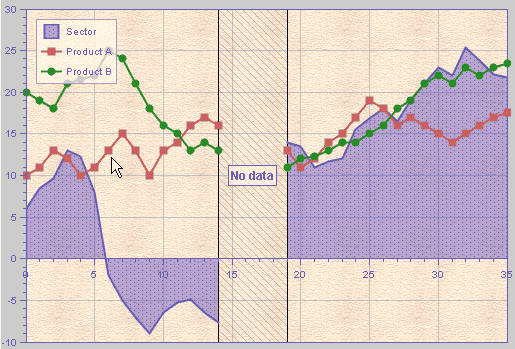
Cartesian charts represent data in a standard way. The data is expressed using a Cartesian system of coordinates (x, y). The x- and y-coordinates are plotted along the abscissa and ordinate scales, respectively. The scales are rectangular and are displayed orthogonally.
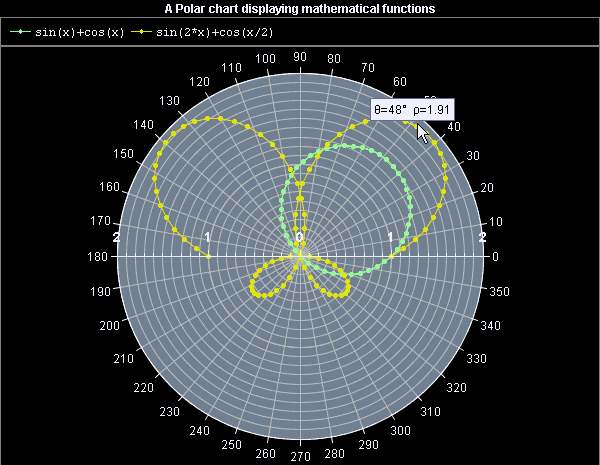
Polar charts represent data in a circular way. The data is expressed using a polar system of coordinates (ρ,
θ). The abscissa values are plotted along a circular scale. The ordinate scale, along which the -coordinates are plotted, is rectangular and is displayed radially.
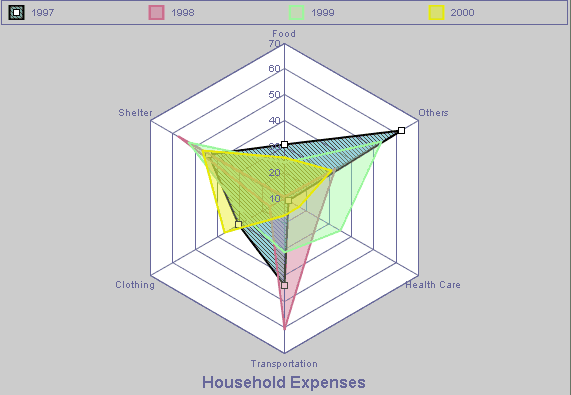
Radar charts.
A radar chart allows us to see data series relationships and make comparisons based on multiple categories. In a radar chart, each category of values has its own axis radiating from a center point. Lines connect all the values in the same category series.
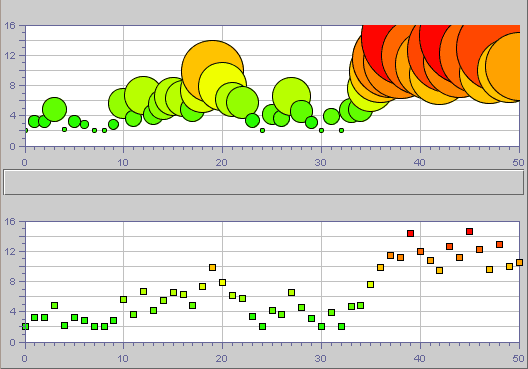
Bubble charts.
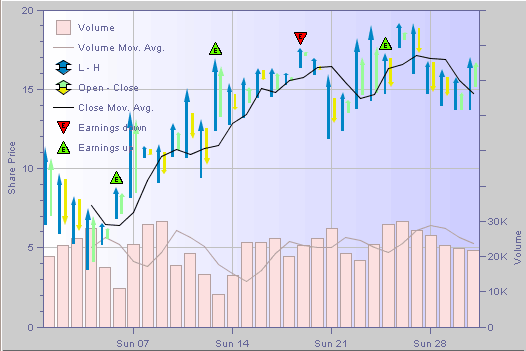
High/Low Charts.
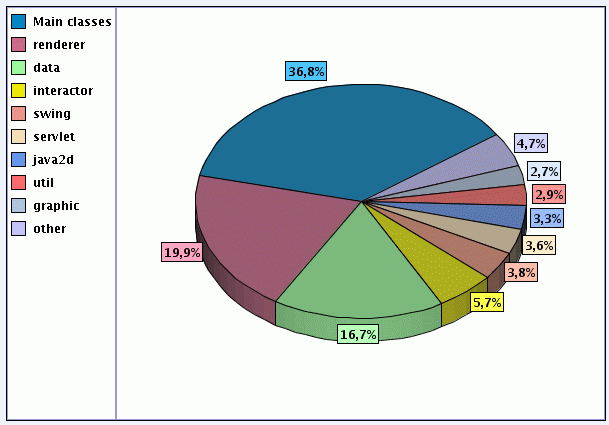
Pie Charts.
A pie chart is used to represent percentages and proportions with which a whole is composed from parts.
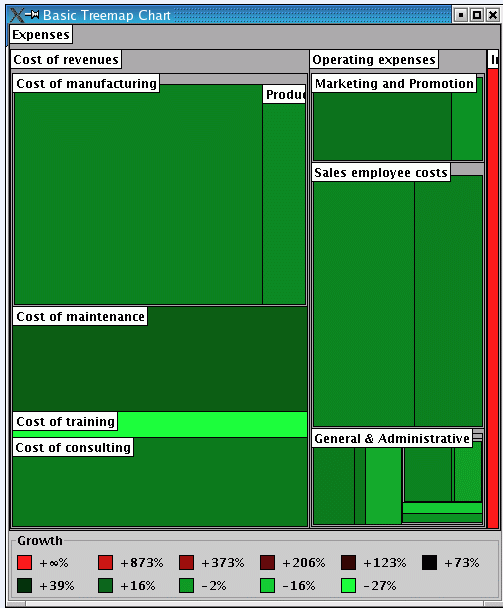
Treemap Charts.
A treemap chart is like a multiple level pie chart. It allows you to see important elements and hides unimportant details.
Copyright © 2018, Rogue Wave Software, Inc. All Rights Reserved.