Adding decorations for alarm severities
You can customize nodes represented by symbols to show changes in the objects in your diagram, for example changes in the status of network nodes. A symbol gives you scope for complex representations and allows you to modify the styling dynamically at run time.
To add decorations to the nodes:
1. Select the node rule in the Style Rules pane and click Edit > Create Style Rule.
a. In the Conditions page, specify the condition status equals Unavailable.
b. Click Finish.
c. In the Style Rules pane, rename the new rule to node[status=Unavailable].
d. With the node[status=Unavailable] rule selected, set the criticalAlarms parameter value to 1.
e. Press Enter.
2. Select the node rule in the Style Rules pane and click Edit > Create Style Rule.
a. In the Conditions page, specify the condition major exists and not null.
b. Click Finish.
c. In the Style Rules pane, rename the new rule to node[major].
d. With the node[major] rule selected, right-click the field majorAlarms in the Styling Customizer.
e. Click Enter an Expression.
f. Delete the current value and specify @major.
g. Press Enter.
3. Select the node rule in the Style Rules pane and click Edit > Create Style Rule.
a. In the Conditions page, specify the condition minor exists and not null.
b. Click Finish.
c. In the Style Rules pane, rename the new rule to node[minor].
d. With the node[minor] rule selected, right-click the field minorAlarms in the Styling Customizer,
e. Click Enter an Expression.
f. Delete the current value and specify @minor.
g. Press Enter.
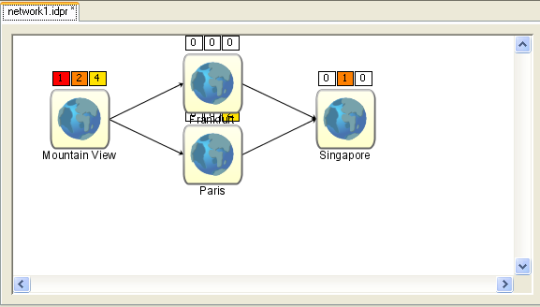
As you add rules, the diagram changes to reflect the current status of the network.
The resulting diagram looks like the following figure:
h. 
Network diagram with alarm decorations
4. Save the network diagram and keep it open to use in the next section.
If your diagram is connected to network data that changes dynamically, the icons reflect the availability of nodes and any alarm recorded on each node.
To test this behavior:
1. Double-click a node to display its data properties.
2. Change the alarm or status value.
3. Watch the diagram change.
Copyright © 2018, Rogue Wave Software, Inc. All Rights Reserved.
