Applications
Rogue Wave JViews Maps includes the following applications:

Map Builder
Symbol Editor for
JViews DiagrammerDesigner for
JViews DiagrammerDashboard Editor
JViews DiagrammerMap Builder
This tool is used to define the background of your runtime application. However, if your application needs to configure its background dynamically at run time, you can use the Rogue Wave JViews Maps SDK directly.
With just a few mouse clicks, the Map Builder allows you to:
Import map data from a wide variety of map data formats and parameters.
Combine them on different layers, mixing both vector and raster data sets.
Alter the map features such as the colors or widths of roads and boundaries.
Control the visibility and appearance of the layers, depending on the desired zoom level. This enables you to have meaningful information displayed, according to the operational context.
Choose an appropriate projection.
And much more...
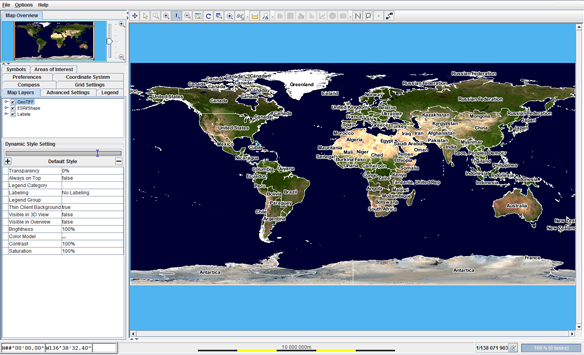
An example of the Map Builder for Rogue Wave JViews Maps is shown below:
Map Builder for Rogue Wave JViews Maps
The end result can be saved as a map definition file that is loaded at run time.
NOTE >> Although the Map Builder is a tool for defining the background maps of an application, it also serves two other functions important for getting started with the product:
SDK exploration: the Map Builder offers an easy way to accelerate your evaluation of the wide variety of features offered by the SDK.
Jump starts developments: the Map Builder is delivered as source code and built using Rogue Wave JViews SDKs. You can reuse code fragments in your final application.
Symbol Editor
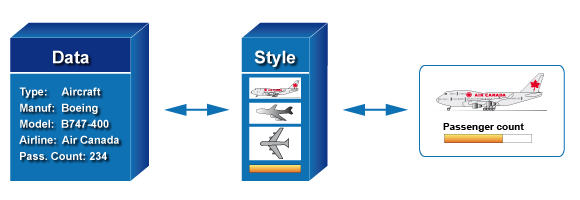
Rogue Wave JViews Diagrammer is bundled with Rogue Wave JViews Maps and manages the foreground interactive objects used to depict your assets. Rogue Wave JViews Diagrammer adds a data-driven, rule-based philosophy:
You manipulate the application data model, adding, removing, and modifying your assets.
You define the styling rules that state how the data model is displayed using symbols. The styling rules are based on the Cascading Style Sheet (CSS) standard.
By applying the data model and the style sheets, Rogue Wave
JViews Diagrammer creates and displays the symbols.
When the data model changes, changes in the symbols or their graphics are triggered.
When users interact with the graphics, they can trigger data model changes.
An example of styling rules is shown below:
Styling rules
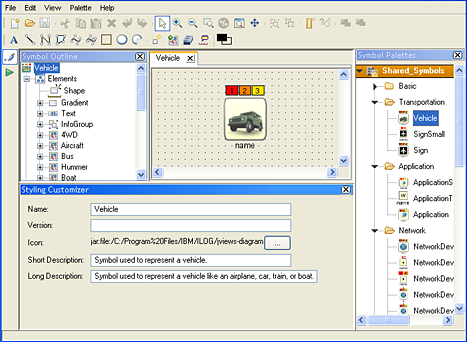
Contained in JViews Diagrammer, the Symbol Editor is a point-and-click interface used to create palettes of rich interactive symbols. These symbols combine graphic parts, custom behavior, and interactions. They can be used to populate graphical views of your applications.
Symbol Editor
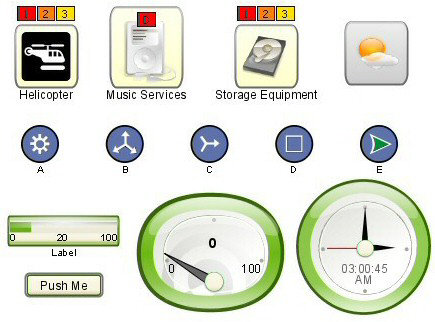
Symbols can be used to represent:
Geo-referenced graphics for monitoring and management applications. Such symbols are overlaid on background maps to depict, for example, vehicles, moving assets, or meteorological symbols. In addition to visual definition, these symbols include the required behavior for displaying information as status or any other application-specific monitored asset information.
Graphical nodes in graphs, topologies, entity-relationship diagrams or business processes.
Other GUI objects such as buttons, sliders, and check boxes.
Typical symbols
Designer for JViews Diagrammer
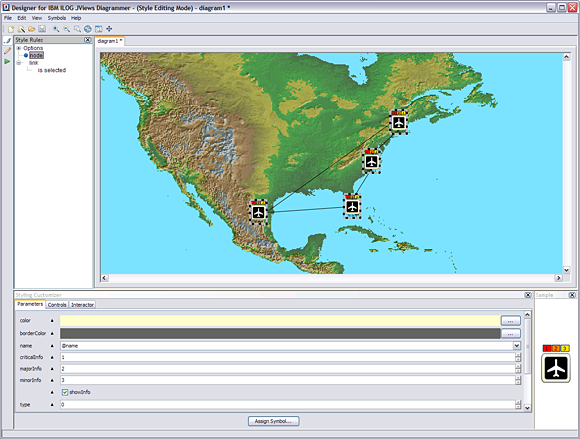
Designer for JViews Diagrammer is a point-and-click application used to create the styling rules that specify the visual appearance of your application data.
Designer for JViews Diagrammer
Designer for JViews Diagrammer gives you a clear idea of the final display, as it allows you to import a sample data model, the map files created with the Map Builder, pre-built or custom symbol libraries, and interactively test rules on these data sets. By using the Designer, you can describe how the domain-specific data model is used by your application and test how this information drives changes to the Symbols.
For example, a rule could look like:
If there is an object of the type Airplane with a Status property equal to Critical
Then modify the monitored_asset parameter so that its background color switches to red
The output is a JViews Diagrammer project file that you import into your application code and extend using the SDKs.
Dashboard Editor
The Dashboard Editor is a point-and-click interface used to draw all kinds of schematics and dashboards. Made of standard vector graphic objects and dynamic symbols, the resulting dashboards can then be loaded and connected to actual data at run time. This editor is convenient for creating monitoring displays where the symbols are manually positioned on the display and then connected to their underlying real-world business objects.
Copyright © 2018, Rogue Wave Software, Inc. All Rights Reserved.