What is a scale
A scale is displayed within a chart by a dedicated optional scale object. The base class used to represent a scale is the
IlvScale class.
By default, scales are automatically created when a chart is constructed. You can control if scales are automatically created by means of the following constructor:
IlvChart(int type, boolean withScales)
Scales might be defined as a graphical representation of a chart axis. As such, a scale is always associated with an
IlvAxis instance. To determine the axis that has to be associated with a scale when the scale is added to a chart, use the following methods:
 setXScale
 associates the specified scale with the
x-axis.
 setYScale
 associates the specified scale with the
y-axis of the given index.
You can retrieve the scale associated with an axis from the axis index using the following methods:
NOTE Since scales are optional components, these methods may return null if no scale has been previously set on the specified axis.
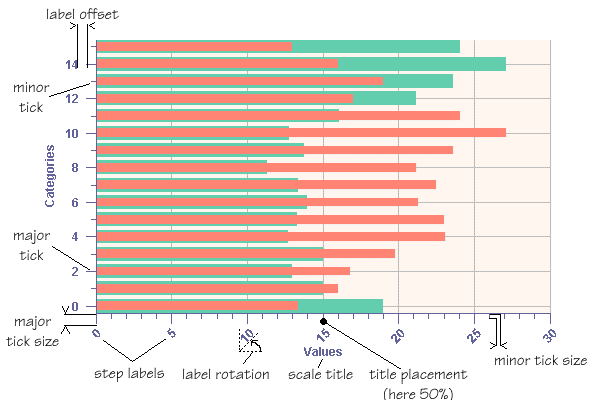
A scale is composed of the following elements:

An
axis representation, which depends on the chart projection (could be a line or an arc).
 Major ticks
, the marks drawn on the axis at each step of the scale.
 Steps labels
, drawn next to the major ticks. These labels indicate the values of the coordinate represented by the scale.
 Minor ticks
, the marks drawn on the axis at each substep of the scale.

A
title, which can be placed anywhere along the axis representation.
Scales Structure
Copyright © 2018, Rogue Wave Software, Inc. All Rights Reserved.
