Understanding symbols
A symbol is a collection of graphic objects, parameters and conditions used to give a dynamic representation of changing data. It is made up of objects and other symbols. Once created, a symbol is manipulated either by being imported into other Rogue Wave® JViews products such as the Designer, the Dashboard Editor, or directly using the Rogue Wave JViews Java™ API.
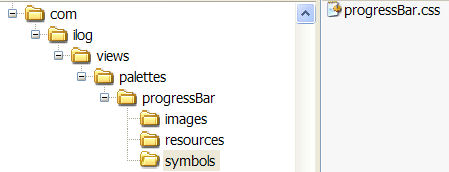
A CSS file is used to store the information necessary to represent a symbol, including the type and position of shapes, text, IVL files, images, and other symbols used to make up the symbol. Symbol data is stored inside the palette file structure. The physical structure of a palette is shown in the following figure.
Symbol structure in a palette
Symbols are based on simple graphic objects created using the Symbol Editor, or more complex images imported from standard graphics packages created by a graphics designer. The following graphics standards are supported:

Portable Network Graphics (
.png )

Joint Photographic Experts Group (
.jpg )

Graphics Interchange Format (
.gif )

Scalable Vector Graphics (
.svg,.svgz )

Rogue Wave JViews Graphics (
.ivl )
Planning a project for the Symbol Editor
Before creating a symbol, you must know what sort of application a symbol will be used for. For example, a BAM application will present only small amounts of specific data that is updated infrequently. An example of this data is the Key Performance Indicators. Symbols for such an application are graphics heavy and integrate many transformations to add intelligence. On the contrary, a SCADA application will use hundreds of symbols to present enormous amounts of data that is updated in real time. In this case, it is essential to create light symbols with as small a memory footprint as possible.
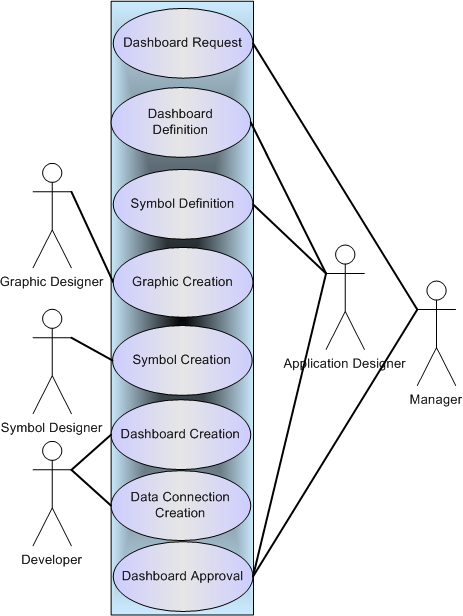
To ensure that you produce symbols that match your application requirements, the best practice is to follow the use case shown in the following figure.
Use case for creating symbols
1. A manager issues the initial dashboard request.
2. An application designer designs the application to be created and the symbols that will be needed.
3. An application designer defines the parameters, constraints, and look and feel for each symbol.
4. A graphic designer creates the graphics.
5. A symbol designer creates the symbols with the Symbol Editor.
6. A developer integrates the symbols into an application using the Rogue Wave JViews application.
The application is approved by the application designer and the manager.
Copyright © 2018, Rogue Wave Software, Inc. All Rights Reserved.

