Main features of a chart
JViews Charts offers you the following features:

Full-featured API. Dedicated classes that allow you to display your data in charts. These charts can be customized in various ways, and you can interact with these charts in different manners.

Optimum performance coupled with a clean object architecture that makes it the best solution for handling large and/or dynamic data models such as real-time supervision system applications.

Wide range of chart displays: Polyline, Bar, Area, Bubble, High-Low, Scatter, Stair, Combo, Pie, Treemap.

Easy customization.

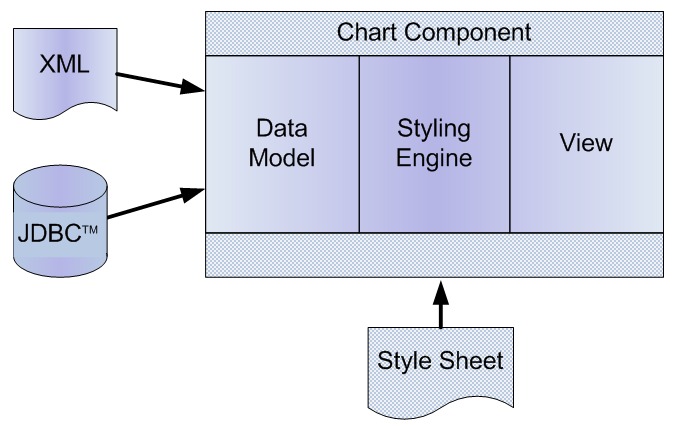
A clear separation between the data and the graphical representations of the data.

Charts are
data-aware. Changes made to data are automatically reflected in the charts that display this data. The possible modifications made by interacting with a chart are also automatically reflected on the data.

Dynamic control of the chart appearance by means of cascading style sheets (CSS).
Chart Component Architecture

Integration in any Swing-enabled Java™ application as a classic JComponent.

Integration in Eclipse®/RCP applications as an SWT control.

A set of JavaBeans™ that can be used within your favorite IDE (Integrated Development Environment).

Coordinate transformation along a given axis. The transformation can be either linear or non-linear, which allows you to implement features such as logarithmic axis or local zoom.

Load On Demand
The load-on-demand mechanism allows you to connect the charts to very large data sets by providing a control on the memory usage by loading only the values that need to be displayed.

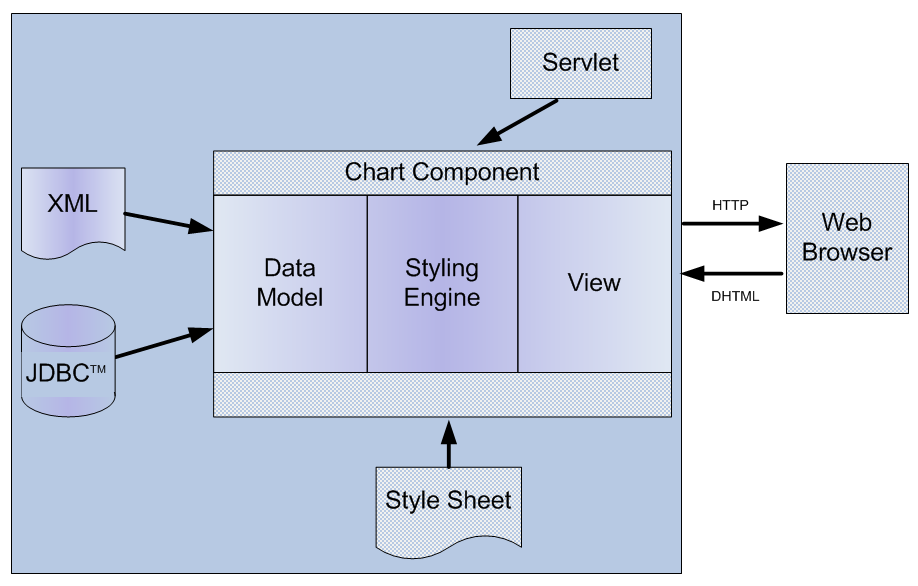
Thin-Client architecture

A set of classes based on the standard Servlet Java technology

Built-in support for image generation

JPEG and PNG image output formats natively supported (additional formats can be added through custom encoders)

Automatic client-side image map generation

JavaServer™ Faces tag library for the development of server pages
Thin-Client Chart Application Architecture

Customizers. These are predefined Swing components that can be used to change particular aspects of the style sheet of a chart component.

Full Printing API

Based on the standard Java 2 Printing API

Multiple-page printing

Rich page format (paragraph alignment, local fonts, and so on)

Composite document (Chart, table, text in one document)

Extensible framework
Copyright © 2018, Rogue Wave Software, Inc. All Rights Reserved.

