Scales Page
The Scales page lets you define the scales used in the current chart. A chart can have one abscissa scale and as many ordinate scales as you want.
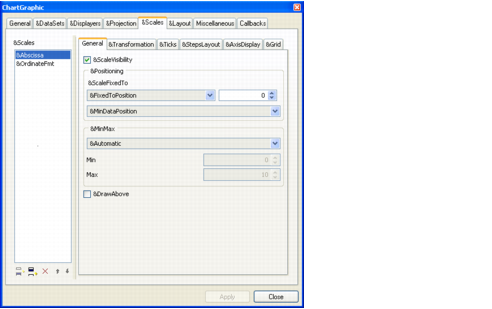
Figure 1.10 Chart Inspector: Scales Page
The Scales page is divided into several subpages that allow you to set various parameters for the selected scale.

On the General subpage, you can set:
the position of the scale. The scale can be fixed to a data value or to a relative position expressed in pixels.
the minimum and maximum data values represented by the scale.
On the Transformation subpage, you can set the transformation applied.
The transformations that can be applied are composed of an elementary transformation, optionally followed by a logarithmic transformation. If you want to apply a transformation to the data, you must first select a defined elementary transformation from the drop-down list. Optionally, you can then set a logarithmic transformation. If you want to apply a logarithmic transformation but you do not want to apply a particular elementary transformation before, just select Identity in the drop-down list showing the defined elementary transformations.
On the Steps subpage, you specify how the steps of the chart are defined. The steps can be defined automatically or by specifying the number of steps, the step unit, or the labels that will be drawn next to the major ticks.
The term “step” refers to the main graduations of a scale and the term “substep” refers to the secondary graduations of the scale. The term “tick” refers to the marks that are drawn on a scale axis at each step and substep. Major ticks are drawn at each step and minor ticks are drawn at each substep. Labels indicating data values are drawn only for the steps of a scale.
On the Ticks display subpage, you specify all the parameters related to displaying ticks. You can specify the size of the ticks, the color, the visibility, the position (outside, inside, or centered on the axis) of the ticks and the step labels, whether step labels are drawn at the axes crossings, and whether overlapping step labels are drawn.
On the Axis display subpage, you can specify all the parameters related to displaying an axis. You can specify the visibility, whether an arrow is drawn at the end of the axis, the color of the axis, the label drawn at the end of the axis, and so on.
On the Grid subpage, you can specify the parameters for displaying a grid that is associated with the selected scale. You can specify the color of the grid, its visibility, whether only major lines are drawn or whether both major and minor lines are drawn.
Version 6.0
Copyright © 2015, Rogue Wave Software, Inc. All Rights Reserved.