Component Classes
Objective Chart uses a component-based drawing architecture. Components are display-panel primitives that may be positioned on-screen or on the printer page. They include attributes that manage background, border, and foreground appearance. Various component classes are provided to support features of presentation-style charts. A single panel can represent the whole chart or many panels may be assembled to make a presentation chart or multiple chart windows.
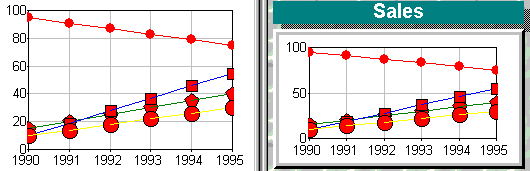
The figure below shows two graphs generated from the same data. The image on the left uses a single display component. The image on the right uses a set of panels arranged to form a presentation style chart.
Visual components
The basic component panel is positioned by a specialized rectangle class, SRGRect. This class uses floating point numbers to define the left, top, right, and bottom extents in a similar way to the MFC CRect object. Because the rectangle uses a floating-point coordinate system, the panels may be placed using one of four measurement units. These are pixels, millimeters, inches, or a percentage of the available window area.
Each component has a background pane that can be filled with solid colors, color gradients, or tiled or stretched images. Each component panel also has a border and shadow that can be drawn in a variety of styles. Style selections are kept in an SRGraphStyle object.
Objective Chart supplies a variety of specialized component classes that allow you to add a background frame, title, labels, and a legend to a chart. The display component handles the drawing of the axes, labels, and data items for all the available graph and axis types. The component classes are discussed individually in the following sections.
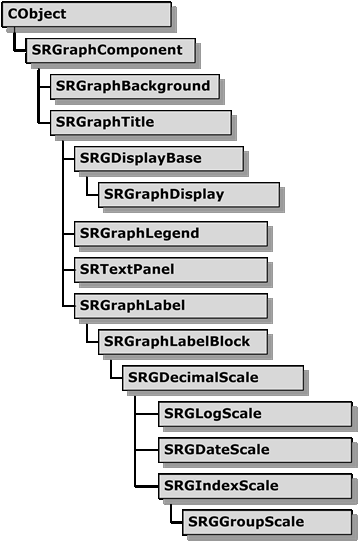
Graphic component hierarchy shows the hierarchy for the Objective Chart component and axis drawing classes.