Strata Vertical Bar Graphs
CX_GRAPH_STRATAVBAR
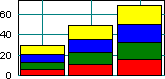
A Strata Vertical Bar graph is what others might call a stacked bar graph. It shows the summed total of a particular index over all groups. The length of the combined bar represents the total over all groups. Areas within the bar show how much each group contributes to the total. For example, a strata bar chart could be used to show the market share of individual car manufacturers (groups) over several years (indices).
Because negative values can not be represented, a standard bar chart is drawn if the data contain negative values.
The bars’ appearance is determined by the settings in the style member of the individual data items. If the interior and frame styles of a data item are set to NONE, the style of the first group is used (SRGraphDataList object).
Classic or Iso Classic Axis. One group per series. One bar per index.


