RoofTop Graph
CX_GRAPH_ISO_AREA
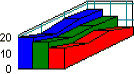
An IsoArea or Roof Top graph is similar to an IsoBar graph except the roof top between data values comprises sloped surfaces rather than steps. No lines are drawn to separate the indices.
The appearance of each group is determined by the group’s style object. Because negative values can not be represented, a standard bar chart is drawn if the data contain negative values.


