Manhattan Graph
CX_GRAPH_ISO_BAR
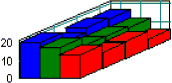
An IsoBar or Manhattan graph represents data values as a three-dimensional rectangle. The data value is plotted against both its group and index. The resulting chart resembles the Manhattan skyline.
The appearance of the bars is determined by the settings in the style member of the individual data items. If the interior and frame styles of a data item are set to NONE, the style of the first group (SRGraphDataList object) is used.
Because negative values can not be represented, a standard bar chart is drawn if the data contain negative values.


