Hi-Low-Open-Close Graphs
CX_GRAPH_HILO_OPENCLOSE
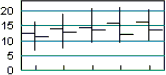
The Hi-Low-Open-Close graph displays the same information as the Candle graph. A vertical line is drawn from the low value to the high value. The open value is indicated by a horizontal line segment to the left of the vertical Hi-Low line. A line to the right represents the close value.


