Enable Data Culling
If a Line chart is used to display a data set with several hundreds or thousands of data points, data culling can be enabled to improve display speed. If data culling is enabled, the Line chart plots every Nth data value, where N is determined by the number of data values to be displayed and the width of the display rectangle in pixels. The user can zoom in on a section of data to reveal more detail.
The following code demonstrates how to enable data culling for a Line chart and other techniques for maximizing display speed.
SRGraphDisplay *pD=new SRGraphDisplay;
pD->GetStyle()->SetGraphStyle(CX_GRAPH_LINEONLY);
pD->GetStyle()->SetAxisStyle(CX_AXIS_CLASSIC);
pD->SetMaxRangeY(1100); // fixed scale improves speed
pD->SetMinRangeY(0);
pD->GetStyle()->SetUseMaxScale(TRUE);
pD->GetStyle()->SetCull(TRUE); // enable data culling
m_Graph.AddComponent(pD);
m_Graph.SetFeedbackLogging(FALSE); // faster draw
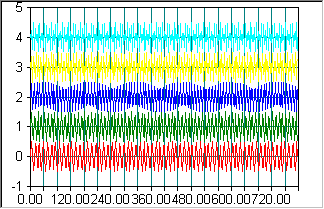
Sine waves (5000 points) without culling shows a line chart without data culling, while Sine waves (5000 points) with culling shows a line chart with data culling enabled.
Sine waves (5000 points) without culling

Sine waves (5000 points) with culling