Candle Graphs
CX_GRAPH_CANDLE
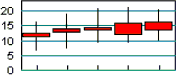
A Candle graph displays high, low, open, and close data. A single series is held in four consecutive groups. Group zero is the high value; group one, the low; group two, the open; and group three, the close. The sequence repeats thereafter with group four being the high values of the second series.
A small rectangle covers the range between the open and close values. A vertical line connects the high and low values.
The appearance of the lines and bars is determined by the settings in the style member of the individual data items of the first group. If the interior and frame styles of a data item is set to NONE, the style of the first group is used (SRGraphDataList object).


