Text Formatting Examples
The following sections demonstrate how to format text strings.
Example 1: Basic Text Formatting
This example demonstrates the effects of the text formatting commands, where !N indicates the normal text level and the original character size. It displays the text using the XYOUTS procedure. The following code produced the text shown in Formatted Text. In this example, the default font is used.
b = '!LLower !NNormal!S!UUp!R!DDown' + '!N!S!AAbove!R!BBelow'
XYOUTS,.02,.2,b,size=3,/Normal
|
|

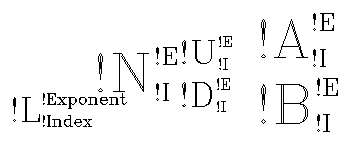
Example 2: Changing the Position of Text
This example demonstrates further the use of formatting commands to change the relative position of text. In this example, the font is changed from the default to the Complex Roman font (!6). The result is shown in Positioning Text:
A = '!6!L!!L!S!E!!Exponent!R!I!!Index' + $
    '!N!!N!S!I!!I!R!E!!E!N'+'!S!U!!U!S!I!!I!R!E!!E!R!D!!D!S' + $
    '!E!!E!R!I!!I!N !S!A!!A!S!E!!E!R!I' + $
    '!!I!R!B!!B!S!E!!E!R!I!!I'
XYOUTS, .02, .5, A, Size = 5, /Normal
|
|
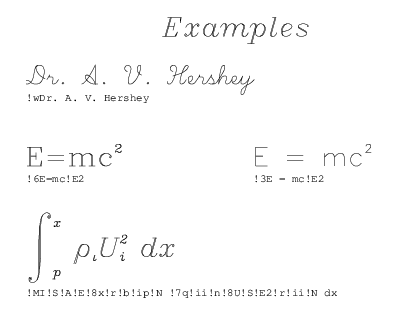
Example 3: Multiple Fonts within a Single String
The third example illustrates the effects of changing the font, and illustrates how complex mathematical symbols can be represented. The code used to produce each line is shown in the figure. The Detailed Discussion section below explains specifically how the integral term shown at the bottom of Mathematical Expressions was produced.
|
|
Detailed Discussion
The bottom integral term shown in Mathematical Expressions was formed by the procedure call:
XYOUTS, 0, .2,'!MI!S!A!E!8x!R!B!Ip!N!7q' + $
    '!Ii!N!8U!S!E2!R!Ii!N dx', SIZE=3, /NORMAL
The formatting commands used to produce Mathematical Expressions are summarized in the Formatting Commands Used in Example 3 .
| Format Command | Description |
|---|---|
| !MI | Changes to math set and draws the integral sign, uppercase I. |
| !S | Saves the current position on the position stack. |
| !A!E!8x | Shifts above the division line and to the exponent level, switches to font 8 the Complex Italic font, and draws the “x”. |
| !R!B!Ip | Restores the position to the position immediately after the integral sign, shifts below the division line to the index level and draws the “p”. |
| !N! 7q | Returns to the normal level, advances one space, shifts to the Complex Greek font (number 7), and draws the greek letter “rho” which is designated by “q” in this set. |
| !Ii!N | Shifts to the index level and draws the “i” at the index level. Returns to the normal level. |
| !8U | Shifts to the Complex Italic set (number 8), and outputs the uppercase “U”. |
| !S!E2 | Saves the position and draws the exponent “2”. |
| !R!Ii | Restores the position and draws the index “i”. |
| !N dx | Returns to the normal level and outputs “dx”. |
Example 4: Annotating a Plot
This example shows a 2D plot that uses formatted software characters for annotation. The following statements were used to produce Plot Drawn with Software Text.
; Define an array.
X = FLTARR(128)
; Make a step function.
X(30:40) = 1.
; Take FFT and magnitude.
X = ABS(FFT(X,1))
; Produce a Log-Linear plot. Use the Triplex Roman font for the
; x title (!17), Duplex Roman for the y title (!5), and Triplex
; Italic for the main title (!18). The Position keyword is used to
; shrink the plotting “window”.
PLOT_OI, X(0:64), Xtitle = '!17Frequency', Ytitle = '!5Power', $
    Title = '!18Example of Vector-Drawn P1ot', $
    Position = [.2, .2, .9, .6]
; String to produce equation.
ss = '!6F(s) = (2!4p)!e-1/2!N !MI!S!A!E!' + $
    'M!R!B!I!M!!NF(x)e !e-i2!4p!3xs!n!MDx'
; Output string over plot. The Noclip keyword is needed because
; the previous plot caused the clipping region to shrink.
XYOUTS, 0.1, 0.75, ss, Size = 3, /Normal, /Noclip
|
|
