Psym
Used With Routines: OPLOT, PLOT, PLOTS, POLYFILL
Corresponding System Variable: !P.Psym
Specifies by reference number a
|
|
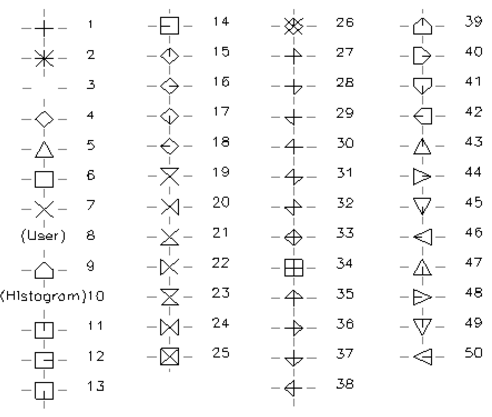
Normally, Psym is 0, data points are
Negative values of Psym cause the symbol designated by |Psym| to be plotted at each point with solid lines connecting the symbols. For example, a Psym value of –5 plots triangles at each data point and connects the points with lines.
The USERSYM procedure creates a user-defined symbol (number 8).
For symbol number 10, Histogram, data points are plotted in the histogram mode. Horizontal and vertical lines are connect the plotted points, as opposed to the normal method of connecting points with straight lines.
When used with PLOT, OPLOT, and PLOTS, the Psym keyword can specify an array of plot symbols. If an array is used, each plot symbol value in the array is applied, in order, to create the plot symbols that make up the graph. The symbols are repeated, as needed, to complete the entire graph of the data set.
See also Solid_Psym.
Example
The following code plots an array using points, and then overplots the smoothed array, connecting the points with lines:
; Plot using points.
A = RANDOMU(s, 15)
PLOT, A, Psym=4
; Overplot smoothed data.
OPLOT, SMOOTH(A, 11)