COLOR_PALETTE Procedure
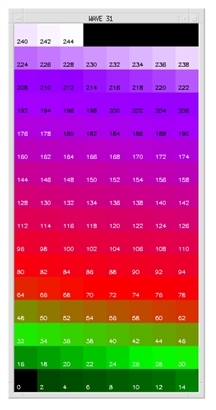
Standard Library procedure that displays the current color table colors and their associated color table indices.
Usage
Parameters
None.
Keywords
None.
Discussion
COLOR_PALETTE works only on displays with window systems. It displays the current color table in a new window, along with the corresponding numerical values or color table indices, thereby letting you visually determine the color associated with a particular color index. This window (Motif version only) is shown in COLOR_PALETTE Window. The COLOR_PALETTE window (Motif version). This window displays every other color in the current color table, along with the corresponding numerical value or color table index. The black cells in the upper-right corner
|
|
Example 1
; Create an array containing the values for a sine function from
; Create an array containing the values for a sine function from
b = FINDGEN(37)
x = b * 10
y = SIN(x * !Dtor)
; Plot data and set the range to be exactly 0 to 360.
PLOT, x, y, XRange=[0,360], XStyle=1, YStyle=1
; Put up window containing display of the current color table and
; its associated color indices.
COLOR_PALETTE
; Load a predefined color table that contains 32 distinct colors.
TEK_COLOR
; Fill in areas under the curve with different colors.
POLYFILL, x, y, Color=WoColorConvert(6)
POLYFILL, x, y/2, Color=WoColorConvert(3)
POLYFILL, x, y/6, Color=WoColorConvert(4)
; Create an array containing the values for a COS function from
; 0 to 360 degrees.
z = COS(x * !Dtor)
; Plot the cosine data on top of the sine data.
OPLOT, x, z/8, Linestyle=2, Color=WoColorConvert(5)
Example 2
OPENR, lun, !Data_dir + 'head.img', /Get_lun
image = BYTARR(512, 512)
READU, lun, image
LOADCT, 0
TVSCL, image
COLOR_PALETTE
LOADCT, 5
LOADCT, 3
See Also
COLOR_CONVERT, MODIFYCT, WgCeditTool, WzColorEdit
For more information about the number of colors that are displayed in the palette, see the PV‑WAVE User Guide.
