SPECTROGRAM Function
Computes the spectrogram of a data sequence.
Usage
result = SPECTROGRAM(x[, length][, overlap])
Input Parameters
x—A one-dimensional array containing the data sequence from which the spectrogram will be computed.
length—(optional) The length of the subsections of x on which to operate.
overlap—(optional) The number of elements overlapped by successive subsections of x. (Default: 0.75*length)
Returned Value
result—A two-dimensional array containing the spectrogram of x.
Keywords
Padding—If present and nonzero and greater than length, subsections of x are padded with the specified number of zeros.
Print_info—If present and nonzero, the number and length of subsections of x are output.
Window_param—The window parameter for a Kaiser window.
Window_type—A scalar value indicating the type of window to use when computing the spectrum of subsections of x. See the Window_type keyword (in the FIRWIN Function ) for a list of available values and window types.
Discussion
The spectrogram is a useful tool for displaying the time-dependent frequency content of a signal. It is also referred to as a Gabor transform, short-time Fourier transform, or waterfall plot.
The spectrogram is determined by breaking the data sequence into length N overlapping data segments represented as
x(n) = x(n + iR), for n = 0, 1, ..., N –1
i = 0, 1, ..., I –1
where R = (N – overlap).
A power spectrum of each data segment is then determined using SPECTRUM. The power spectrum for each data segment is stored as a matrix, with the first index representing the data segment and the second index representing uniform samples of the power spectrum.
The spectrogram is typically displayed as an image with the magnitude of the power spectrum represented by the grey (or color) scale.
Example
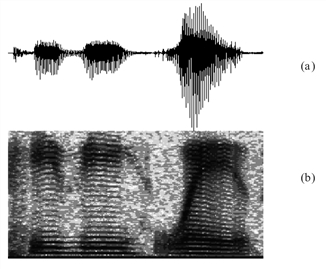
In this example, SPECTROGRAM is used on a file containing a signal of a human voice. The results are shown in Processing and Displaying a Voice SIgnal.
To open the file on a UNIX system:
OPENR, u, GETENV('RW_DIR')+ $
'/sigpro-1_1/test/voice.dat', /Get_Lun
To open the file on a Windows system:
OPENR, u, GETENV('RW_DIR')+ $
'\sigpro-1_1\test\voice.dat', /Get_Lun
x = BYTARR(7519)
READU, u, x
CLOSE, u
xs = 400
ys = 400
WINDOW, XSize = xs, YSize = ys
; Plot the original voice signal.
PLOT, x, Position = [0, .5, 1, 1], XStyle = 5, YStyle = 5, /Normal
; Compute spectrogram of the original signal.
mat = SPECTROGRAM(x, 256)
; Display the spectrogram as an image.
TVSCL, Hist_Equal(CONGRID(ALOG10(mat > 1.e-5), xs, ys/2))
|
|
See Also
For Additional Information
Nawab and Quatieri, 1988.
Oppenheim and Schafer, 1975.


