IIRDESIGN Function
Designs Butterworth, Chebyshev Type I, Chebyshev Type II, and elliptic lowpass infinite impulse response (IIR) digital filters.
Usage
result = IIRDESIGN(n, fp, /Butter)
result = IIRDESIGN(n, fp, rp, /Cheby1)
result = IIRDESIGN(n, fs, rs, /Cheby2)
result = IIRDESIGN(n, fp, rp, rs, /Ellip)
Input Parameters
fp—The pass-band frequency edge.
fs—The stop-band frequency edge.
Returned Value
result—A filter structure containing the coefficients of the IIR filter.
Keywords
Butter—If present and nonzero, designs a Butterworth filter.
Cheby1—If present and nonzero, designs a Chebyshev Type I filter.
Cheby2—If present and nonzero, designs a Chebyshev Type II filter.
Ellip—If present and nonzero, designs an elliptic filter.
Discussion
This function designs Butterworth, Chebyshev types I and II, and elliptic IIR digital lowpass filters. The different filter approximations are illustrated in IIRDESIGN Function Example.
|
|
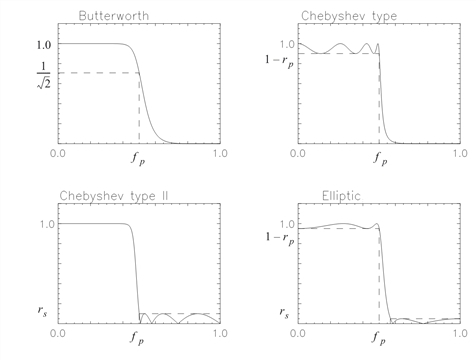
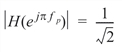
The Butterworth filter is maximally flat in the pass and stop bands. This filter is parameterized by its order (n) and pass-band frequency edge (fp) defined by:
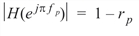
The Chebyshev Type I filter has equal ripple in the pass band. This filter is parameterized by its order (n), pass-band ripple (rp), and pass-band frequency edge (fp) defined by:
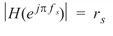
The Chebyshev Type II filter has equal ripple in the stop band. This filter is parameterized by its order (n), the stop-band ripple (rs), stop-band frequency edge (fs) defined by:
The elliptic filter has equal ripple in both the pass band and the stop band. This filter is parameterized by its order (n), the pass-band ripple (rp), and stop-band ripple (rs), the pass-band frequency edge (fp) defined by:

The four filter types are obtained by first designing an analog lowpass prototype filter using the techniques discussed in Parks and Burrus (1987) and then using the bilinear transform to obtain an digital lowpass prototype filter.
The lowpass filters obtained using IIRDESIGN can be transformed into a highpass, bandpass, or bandstop filter using the function FREQTRANS, if desired.
The minimum filter order required to meet a set of specifications for the filters designed by IIRDESIGN may be determined by IIRORDER.
Example 1
In this example, a Butterworth filter is designed and the resulting frequency response is plotted (Frequency Response Plof from Seventh-Order Butterworth Filter).
n = 7
fp = 0.5
h = IIRDESIGN(n, fp, /Butter)
hf = FREQRESP_Z(h, Outfreq = f)
PLOT, f, ABS(hf), YRange = [0, 1.2], $
Title = 'Butterworth Magnitude', XTitle = 'Frequency'
OPLOT, [0, fp], SQRT(0.5)*[1, 1], Linestyle = 2
OPLOT, [fp, fp], SQRT(0.5)*[1, 0], Linestyle = 2
Example 2
A Chebyshev Type I filter is designed and the resulting frequency response is plotted in Frequency Response Plot from Seventh-Order Chebyshev Type I Filter.
n = 7
fp = 0.5
rp = .2
h = IIRDESIGN(n, fp, rp, /Cheby1)
hf = FREQRESP_Z(h, Outfreq = f)
PLOT, f, ABS(hf), Title = 'Chebyshev Type I Magnitude', $
XTitle = 'Frequency'
OPLOT, [0, fp], (1 - rp)*[1, 1], Linestyle = 2
OPLOT, [fp, fp], (1 - rp)*[1, 0], Linestyle = 2
Example 3
A Chebyshev Type II filter, also known as an inverse Chebyshev filter is designed in this example. The frequency response is plotted in Frequency Response Plot from Seventh-Order Chebyshev Type II Filter.
n = 7
fs = 0.5
rs = 0.2
h = IIRDESIGN(n, fs, rs, /Cheby2)
hf = FREQRESP_Z(h, Outfreq = f)
PLOT, f, ABS(hf), YRange = [0, 1.2], $
Title = 'Chebyshev Type II Magnitude', XTitle = 'Frequency'
OPLOT, [fs, 1], rs*[1, 1], Linestyle = 2
OPLOT, [fs, fs], rs*[1, 0], Linestyle = 2
Example 4
In this example, an elliptic filter is designed and the frequency response is plotted (Frequency Response Plot from Fourth-Order Elliptic Filter).
n = 4
fp = .5
rp = .05
rs = .05
h = IIRDESIGN(n, fp, rp, rs, /Ellip)
hf = FREQRESP_Z(h, Outfreq = f)
PLOT, f, ABS(hf), Title = 'Elliptic Magnitude', $
XTitle = 'Frequency'
YRange = [0., 1.2], YStyle = 1
OPLOT, [0, fp], [1-rp, 1-rp], Linestyle = 2
OPLOT, [fp, fp], [0, 1-rp], Linestyle = 2
OPLOT, [fp, 1], [rs, rs], Linestyle = 2
See Also
FREQTRANS, FREQTRANSDESIGN, IIRORDER
For Additional Information
Parks and Burrus, 1987.


