HIST_STATS Function (PV-WAVE Extreme Advantage)
Computes six different statistical operations on image histograms.
Usage
result = HIST_STATS(hist_data)
Input Parameters
hist_data—A 1D or 2D long array containing one or more histograms.
Returned Value
result—A double array with six statistical results (mean, variance, skewness, kurtosis, energy, and entropy, respectively) for each histogram in the hist_data array.
Keywords
Binsize—The bin size used to compute the histogram. (Default: 1.0)
Maxgray—Specifies the maximum graylevel that was considered in computing the histogram values (hist_data). (Default: N_ELEMENTS(hist_data))
Mingray—Specifies the minimum graylevel that was considered in computing the histogram values (hist_data). (Default: 0)
Discussion
Histogram statistics are useful for quantitative image feature descriptions. The statistics returned by HIST_STATS are computed for the normalized image histogram, P, where P is the histogram divided by its total. The statistics returned by HIST_STATS are defined as follows:
Mean:

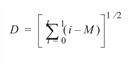
Standard Deviation:
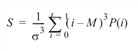
Skewness:
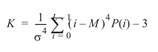
Kurtosis:
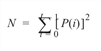
Energy:
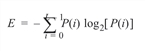
Entropy:
Example
; Read an image.
image = IMAGE_READ(!IP_Data + 'airplane.tif')
image_hist = IPHISTOGRAM(image('pixels')stats = HIST_STATS(image_hist)
; Compute the histogram statistics and print them to the screen.
PRINT, stats


