WgStripTool Procedure
Creates a window that displays data in a style that simulates a real-time, moving strip chart.
Usage
WgStripTool[, x, y1, y2, ..., y10]
WgStripTool[, x[, y1[, y2[, y3[, y4[, y5[, y6[, y7[, y8
[, y9[, y10 ]]]]]]]]]]]
Input Parameters
x — (optional) A vector specifying the x values (horizontal) of each strip chart. If not specified, or set equal to zero, monotonically increasing values, starting with 0 (zero) are automatically provided along the x-axis. Must have the same number of elements as the y vectors.
yn — (optional) Up to ten vectors containing data in the y direction (vertical); each vector is displayed in a separate strip chart. The number of y variables specified determines the number of strip charts that are displayed. All y vectors should contain the same number of elements.
Keywords
Delay — The minimum interval for updating the strip chart, specified in milliseconds (floating point). The default is to have 0 milliseconds of delay.
Parent — The widget or shell ID of the parent widget (long). If parent is not specified, WgStripTool runs on its own (i.e., in its own event loop).
Position — Two-element vector specifying the x- and y-coordinates of the upper-left corner of the WgStripTool window (long integer). The elements of the vector are [x, y], where x (horizontal) and y (vertical) are specified in pixels. These coordinates are measured from the upper-left corner of the screen.
DSize — A two-element vector specifying the width and height of the display area (long integer); the display area is divided equally between the strip charts for all specified y variables. If not specified, the default size of the display area is 512-by-512 pixels.
Shell — The ID of the newly created widget. If the procedure fails, zero (0) is returned.
Title — A string containing the title that appears in the header of the window. Default value is “Stripchart Tool”.
Color/Font Keywords
For additional information on the color and font keywords, see Setting Colors and Fonts in the PV‑WAVE Application Developer’s Guide.
Background — Specifies the background color name.
Basecolor — Specifies the base color.
Font — Specifies the name of the font used for text.
Foreground — Specifies the foreground color name.
Discussion
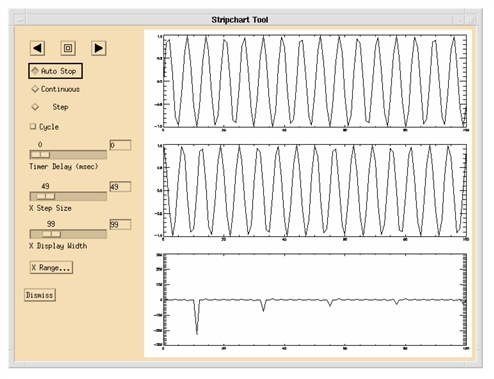
The WgStripTool window, shown in WgStripTool Window, allows you to view data in moving strip charts; you can adjust the display width in the strip charts to create the effect of zooming in and out. You can also adjust the rate and the manner with which the strip charts progress through the data.
|
|
Event Handling
You can use the WgStripTool widget in one of the following two ways:
From the WAVE> prompt — Enter the procedure name at the WAVE> prompt to display the WgStripTool widget. The WgStripTool widget handles its own event loop by calling WwLoop.
Stand-alone widget in its own window created by another application — The WgStripTool widget has its own Main window, but the application (not the WgStripTool widget) handles the event loop by calling WwLoop.
The output parameter shell can be returned only if you also supply the input parameter parent.
Contents of the Window
The StripTool window has two main parts — the display area and the control area.
StripTool Display Area
The display area is the largest area of the window; it is where the data strip charts are displayed. The number of strip charts you see in this area is determined by the number of y variables that were included in the call that invoked the WgStripTool window.
StripTool Control Area
Use the following controls to operate the WgStripTool window:
Reverse button — Cycle through the data in a reverse direction.
Stop button — Freeze strip chart display at current location.
Forward button — Cycle through the data in a forward direction.
Mode — Select Auto Stop to have WgStripTool stop whenever it reaches the beginning or the end of the data in the y variable(s). Select Continuous to have WgStripTool move through the data in a non-stop manner, pausing only when you click the Stop button. Select Step to have the strip chart proceed only when you click on one of the arrow buttons.
Timer Delay — Decrease or increase the rate of display. The number shown to the right of the slider is the number of milliseconds delay between contiguous frames of the strip chart.
X Step Size — The amount by which the strip charts are moved forward or back when the strip charts are updated.
X Display Width — The range of data displayed in the horizontal direction. A small value for display width has the effect of “zooming in” to view a narrow range of data; a large value for display width has the effect of “zooming out” to view a broader range of data.
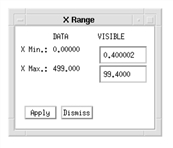
X Range — A more precise way to specify X Display Width. Click this button to display another dialog box containing text fields where you can type precise values for the minimum and maximum values you wish to have displayed along the x-axis. This dialog box is shown in WgStripTool Window Dialog Box.
Dismiss — Destroy the WgStripTool window and erase it from the screen.
The selections you make in the control area affect all displayed strip charts. This way, you can be assured that the data in one strip chart is in “sync” with the data in any other strip chart.
|
|
Example
Enter the commands shown below into a file, and compile the procedure with the .RUN command. If the variable parent is defined, WgStripTool is created as a child of parent; otherwise, WgStripTool runs on its own (i.e., in its own event loop).
When you are finished interacting with the WgStripTool window, close it by clicking on the Dismiss button.
PRO Sample_wgstriptool, parent, tool_shell
; Create an independent variable and three dependent variables
; describing sinusoidal curves to use as data for WgStripTool.
x = indgen(500)
y1 = sin(x)
y2 = cos(x)
y3 = tan(x)
IF N_ELEMENTS(parent) NE 0 THEN BEGIN
; Create WgStripTool as a child of "parent". The window of
; newly created widget is returned via the optional output
; parameter "tool_shell".
WgStripTool, x, y1, y2, y3, $
0, 0, 0, 0, 0, 0, 0, Parent=parent, Shell=tool_shell
ENDIF ELSE BEGIN
; Create WgStripTool and display it as its own Main window.
; In other words, the WgStripTool window runs on its own
; (i.e., in its own event loop). Notice how the zeroes are
; not needed as placeholders, since the optional
; parameters "parent" and "tool_shell" are not being used
; in this procedure call.
WgStripTool, x, y1, y2, y3
ENDELSE
END
See Also
For more information about how to write an application program based on PV‑WAVE Widgets or Widget Toolbox, refer to the PV‑WAVE Application Developer’s Guide.


